Automated EDA Report
Processing Log
- 02:48:30: Loading data from data/data_after_cleaning_and_feature_enginiring_with_customer_id.csv...
- 02:48:31: Data Loaded. Shape: (49661, 46)
- 02:48:31: Converted 'Total_Lifetime_Value' to datetime.
- 02:48:31: Converted 'First_Purchase_Date' to datetime.
- 02:48:31: Converted 'Last_Purchase_Date' to datetime.
- 02:48:31: Converted 'Customer_Lifetime_Days' to datetime.
- 02:48:31: Removed 0 duplicate rows.
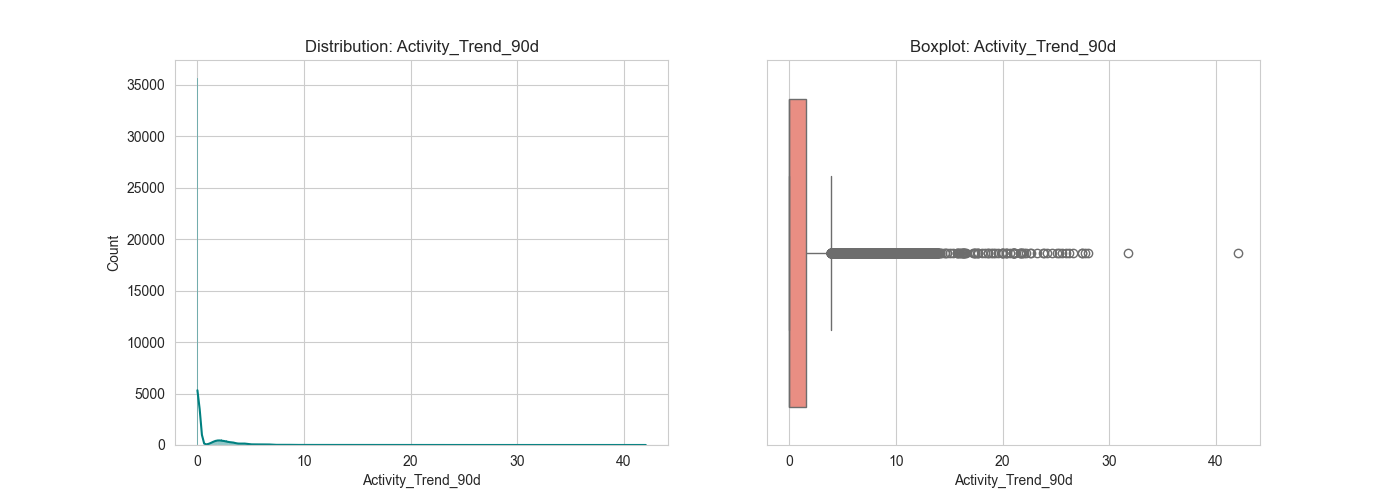
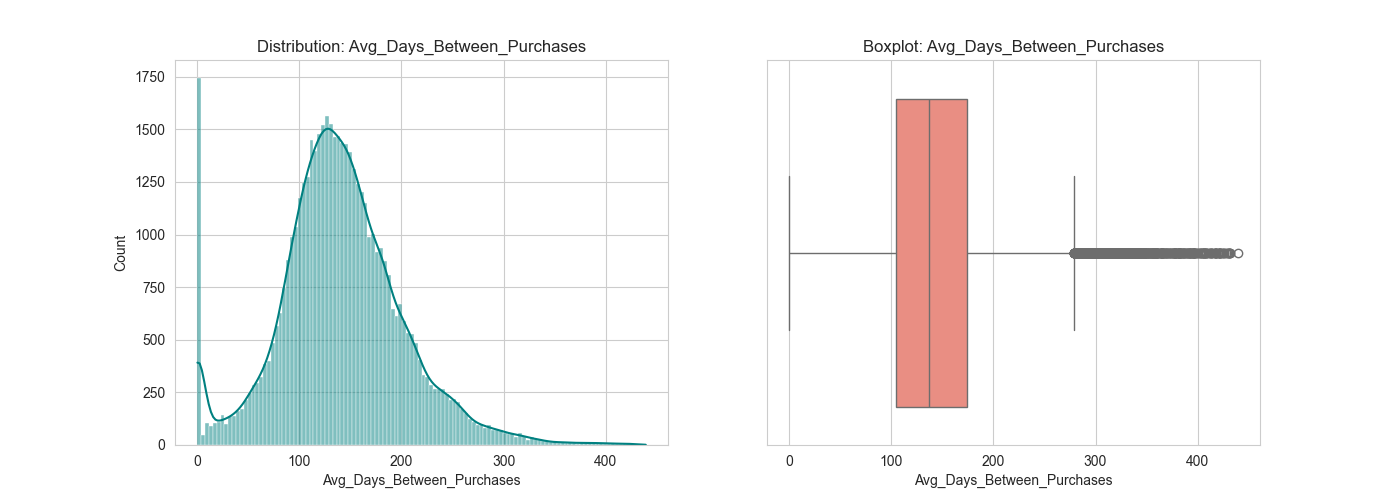
- 02:48:31: Running Advanced Outlier Detection...
- 02:49:14: Outlier detection complete. Saved 'outlier_report.csv'.
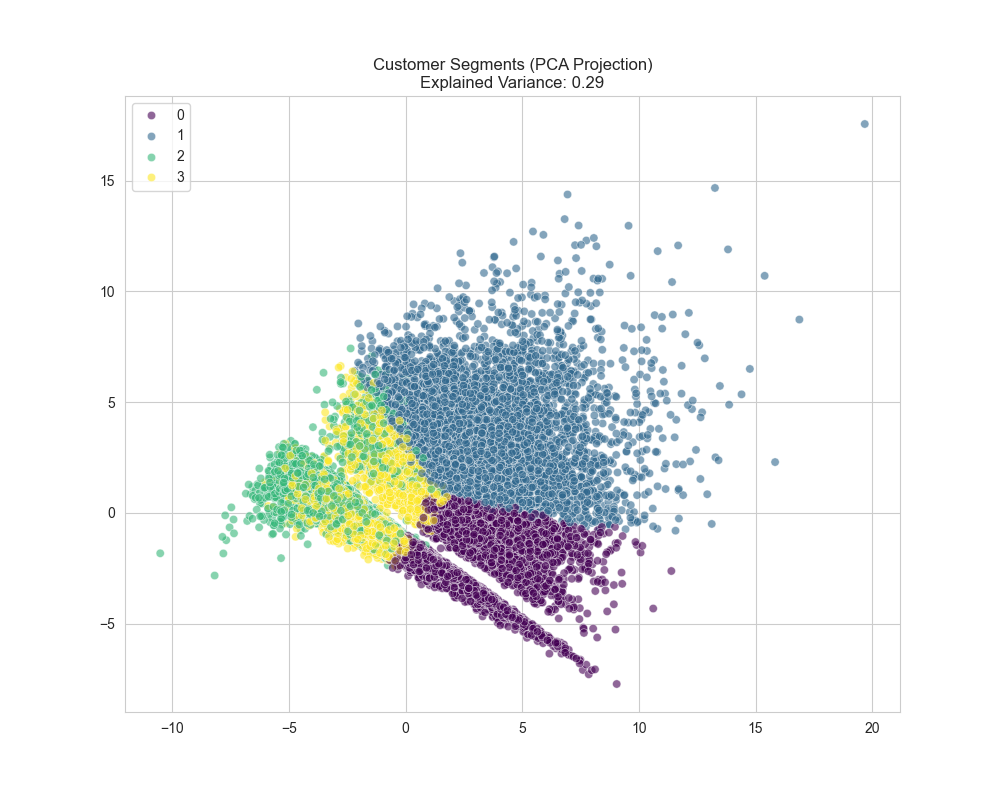
- 02:49:14: Running Clustering (KMeans, k=4)...
- 02:49:17: Clustering complete. Saved PCA plot and profiles.
- 02:49:17: Analyzing Target: Churn
- 02:49:30: Analyzing Time Series using 'Total_Lifetime_Value'...
- 02:49:31: Generating HTML Report...
Visualizations
clustering_pca.png
outliers_Activity_Trend_90d.png
outliers_Avg_Days_Between_Purchases.png
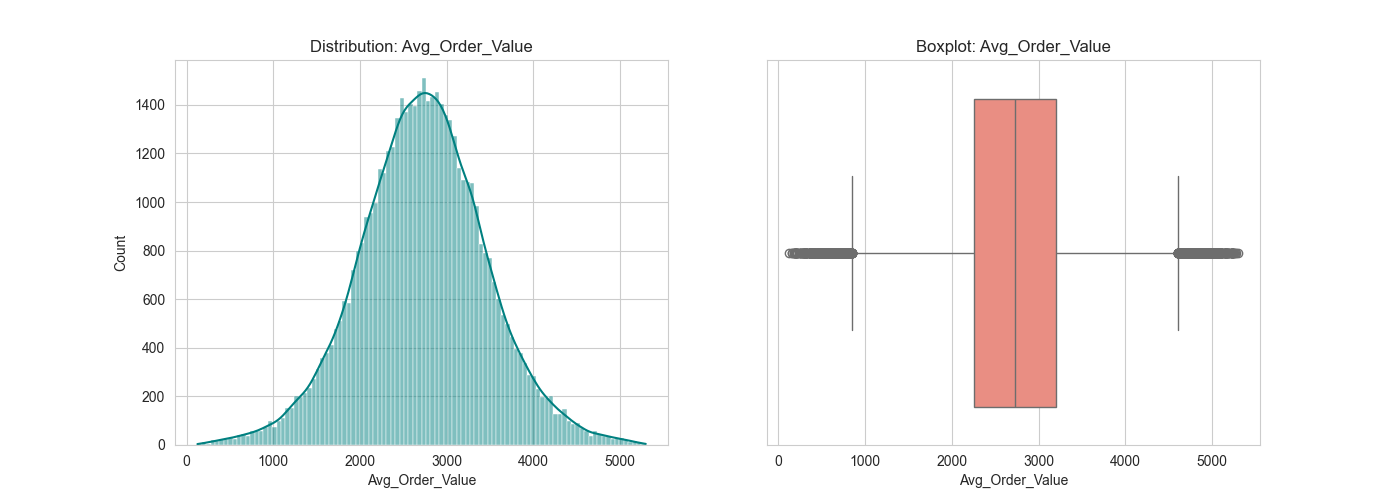
outliers_Avg_Order_Value.png
outliers_Avg_Product_Price.png

outliers_Days_Since_Last_Purchase.png

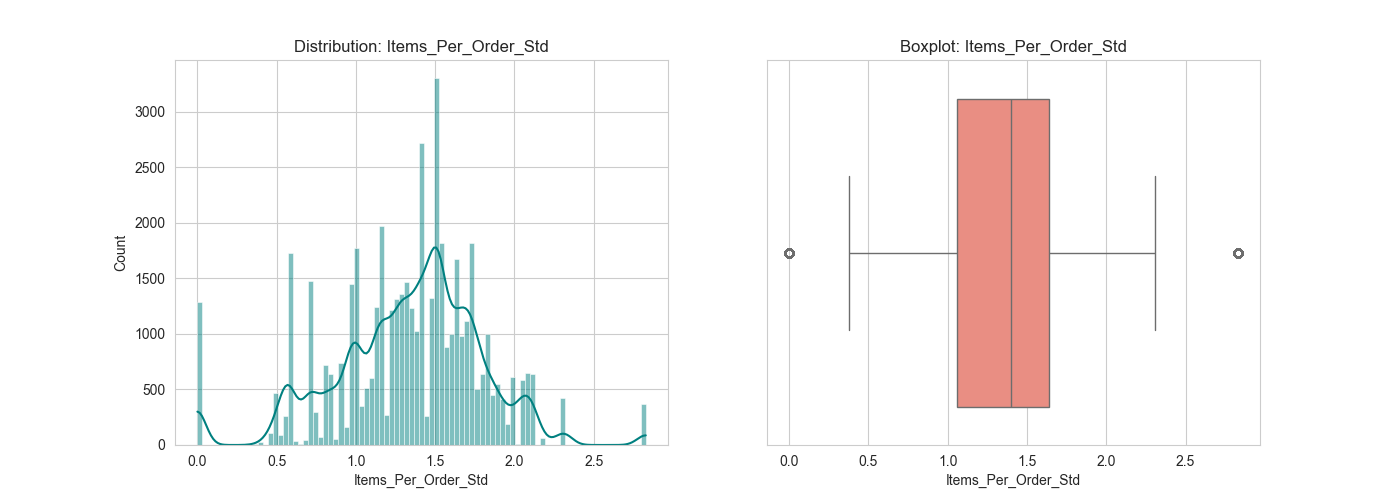
outliers_Items_Per_Order_Std.png
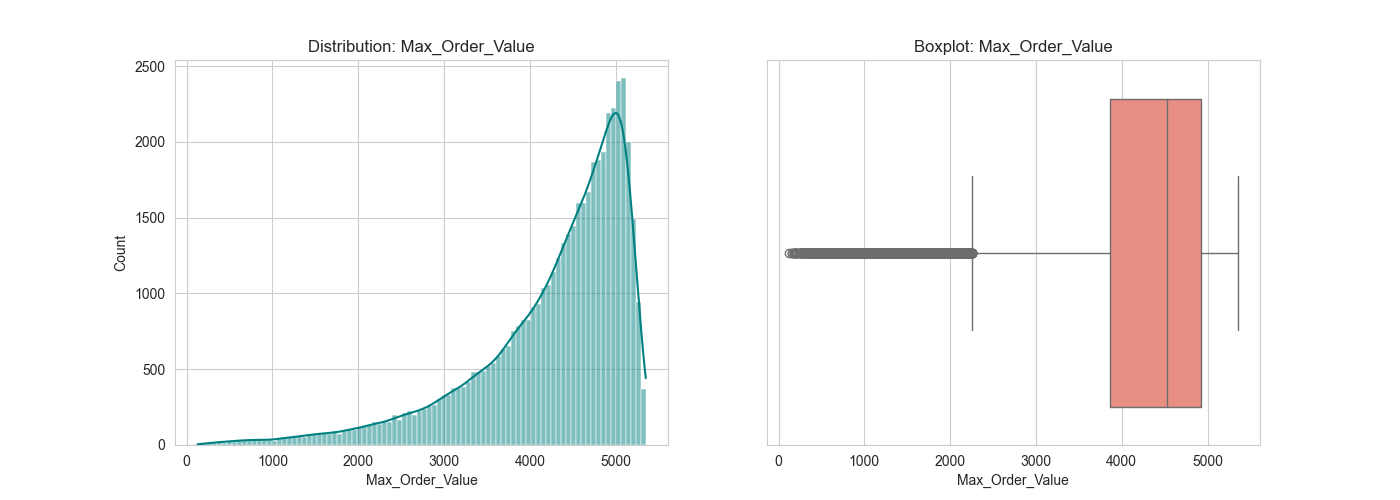
outliers_Max_Order_Value.png
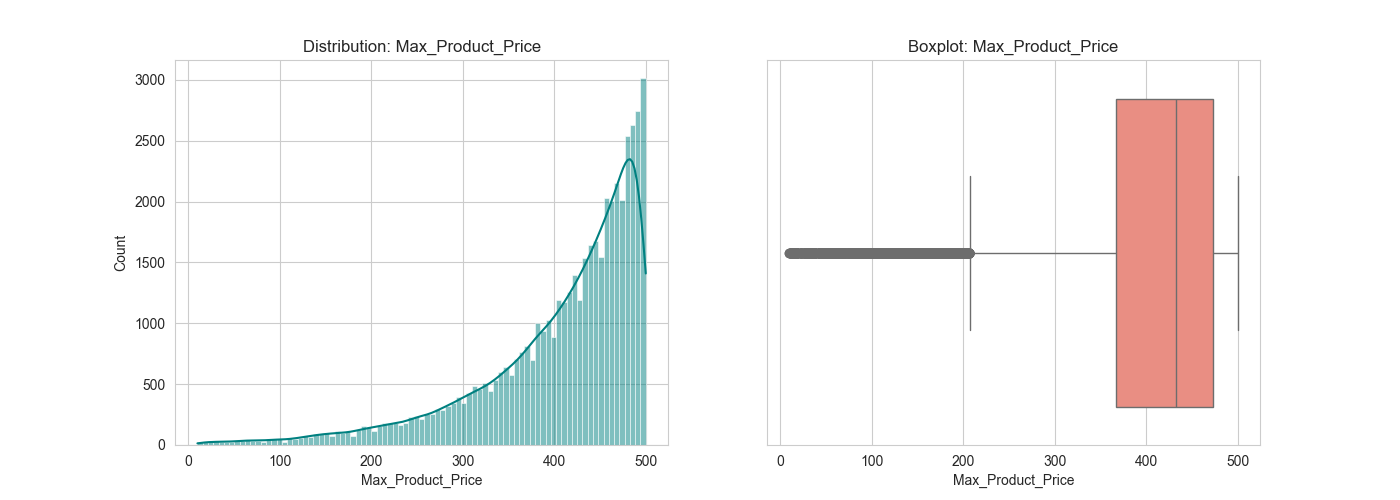
outliers_Max_Product_Price.png
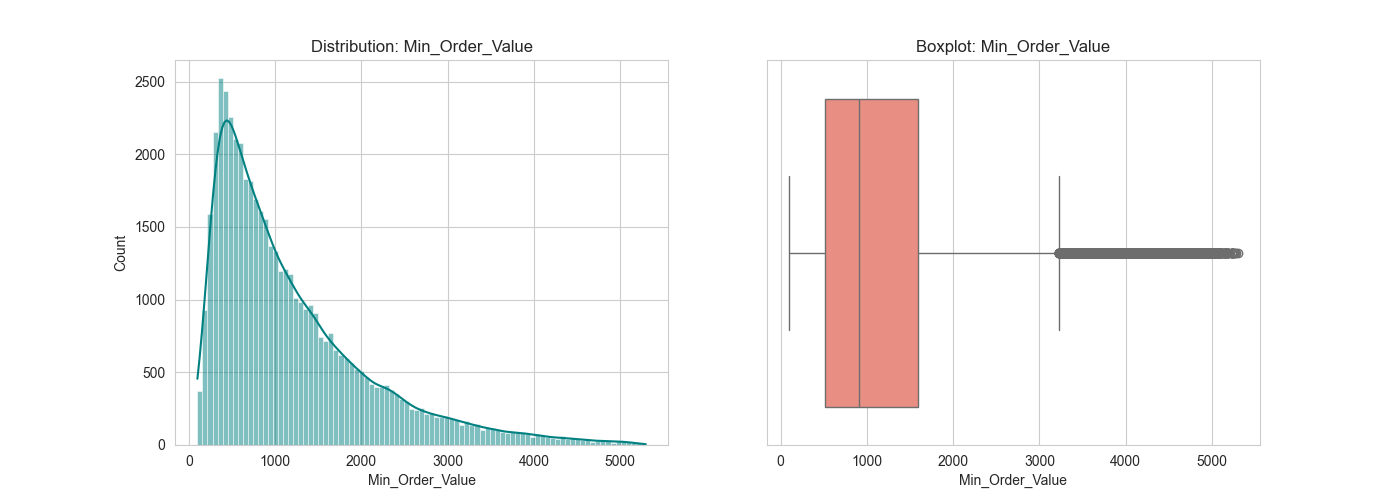
outliers_Min_Order_Value.png
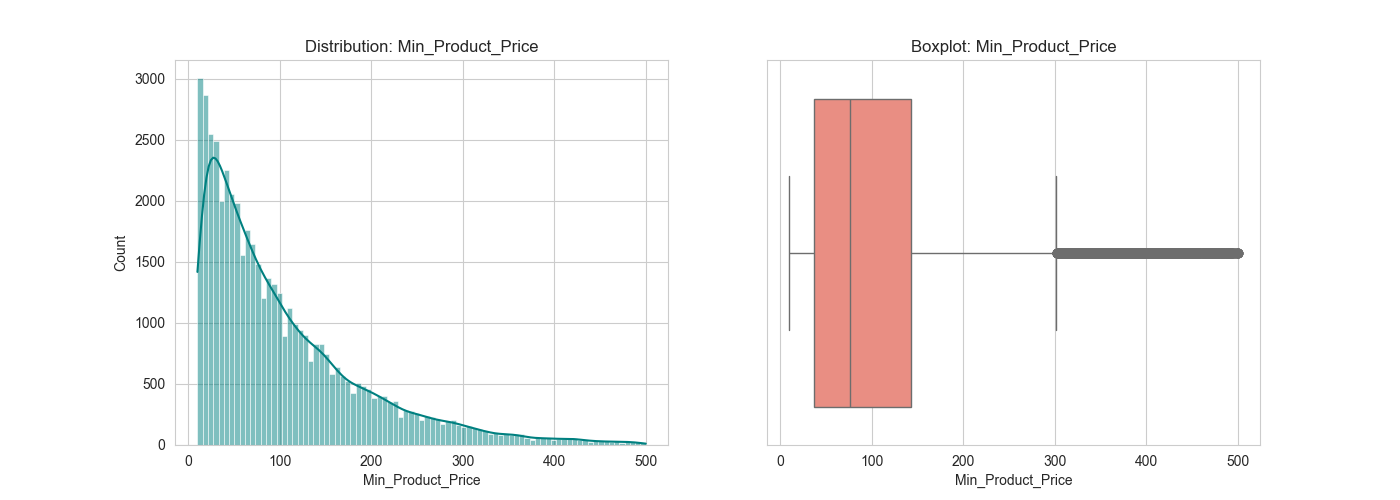
outliers_Min_Product_Price.png
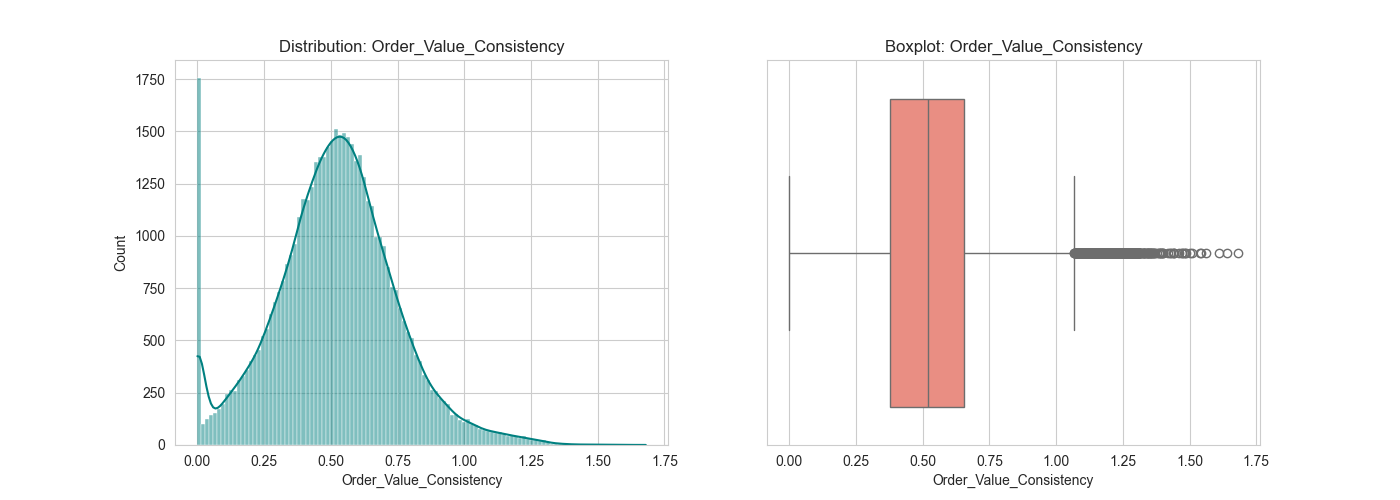
outliers_Order_Value_Consistency.png
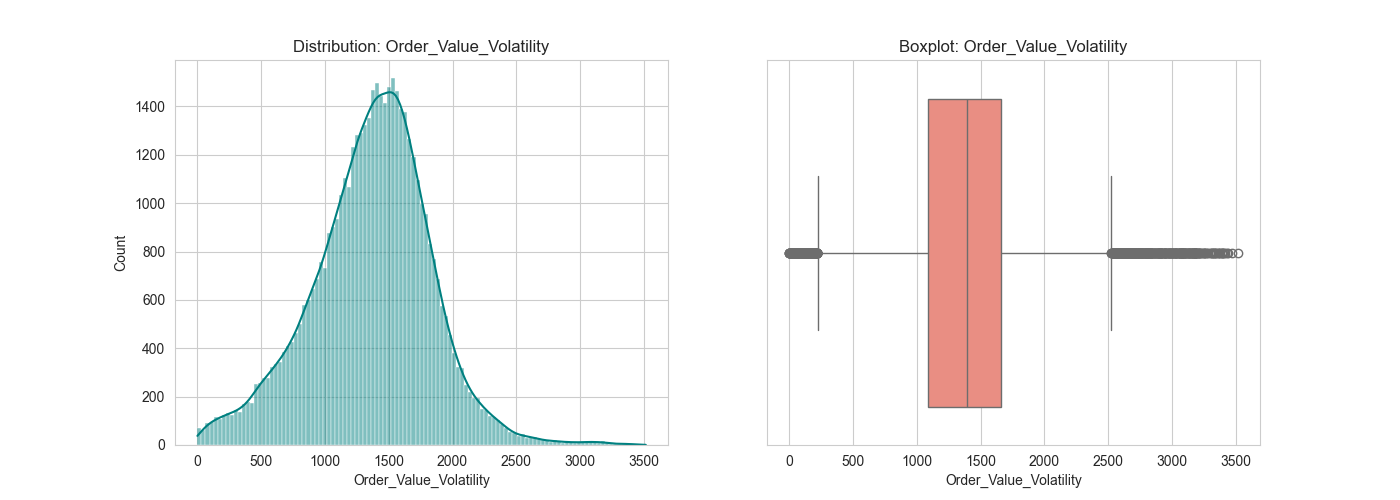
outliers_Order_Value_Volatility.png
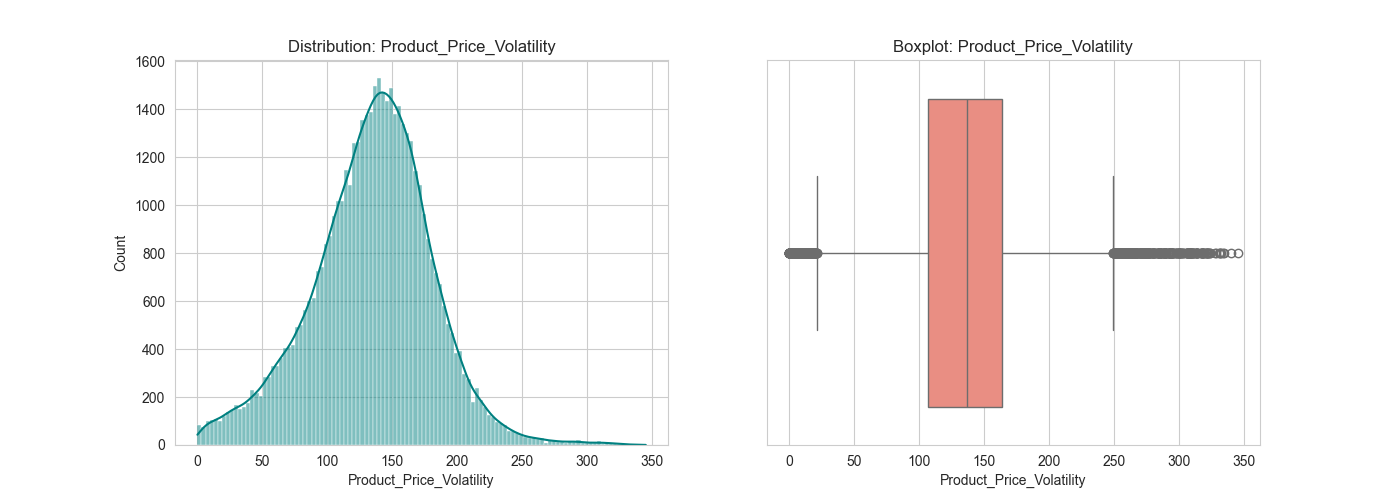
outliers_Product_Price_Volatility.png
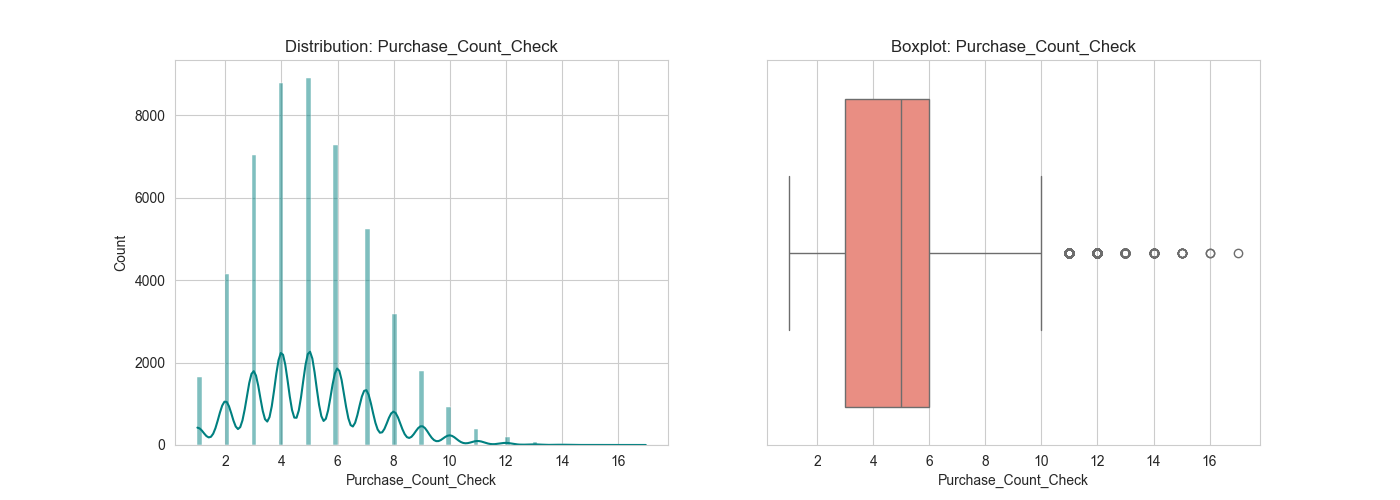
outliers_Purchase_Count_Check.png
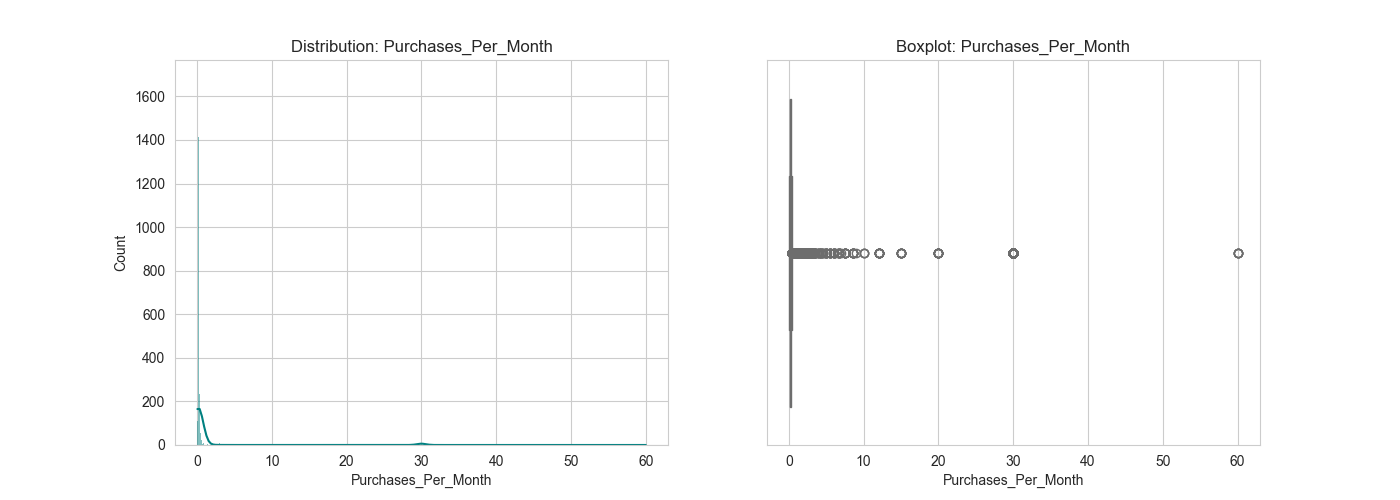
outliers_Purchases_Per_Month.png
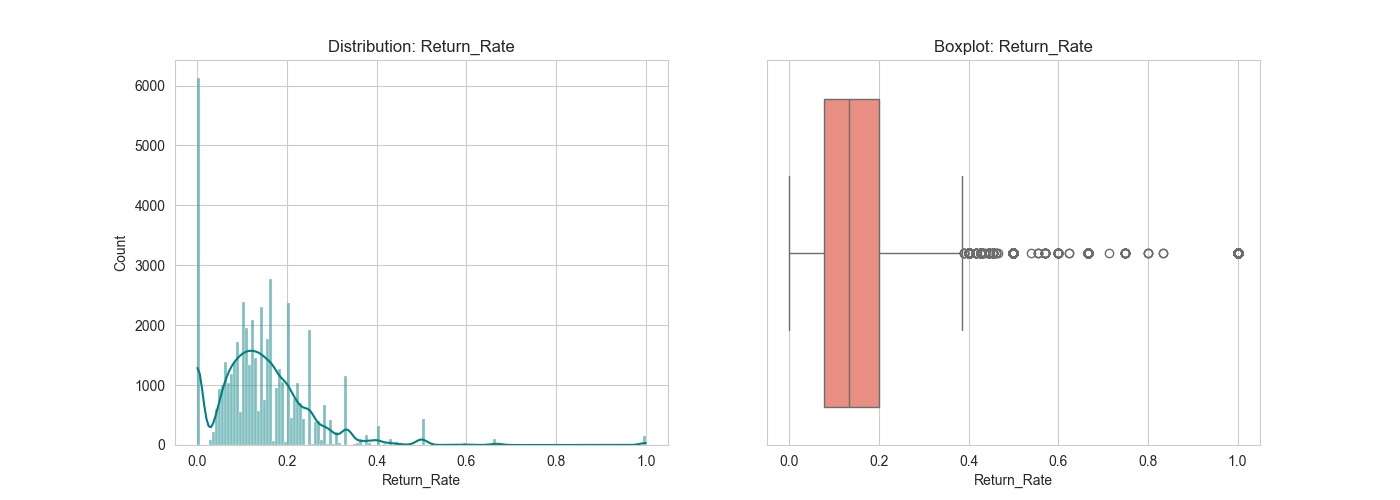
outliers_Return_Rate.png
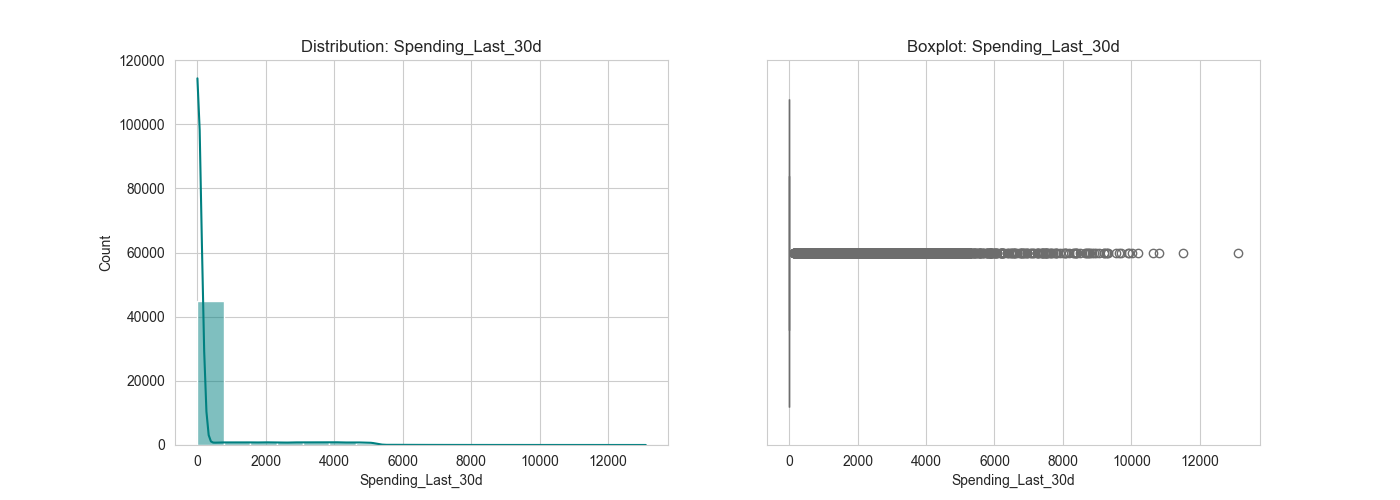
outliers_Spending_Last_30d.png
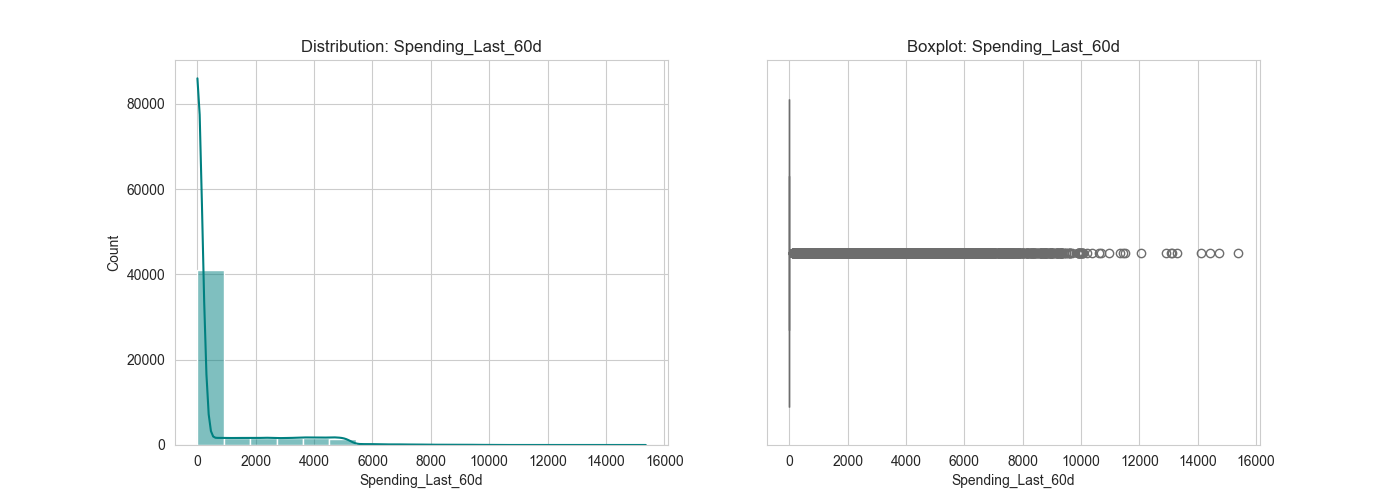
outliers_Spending_Last_60d.png
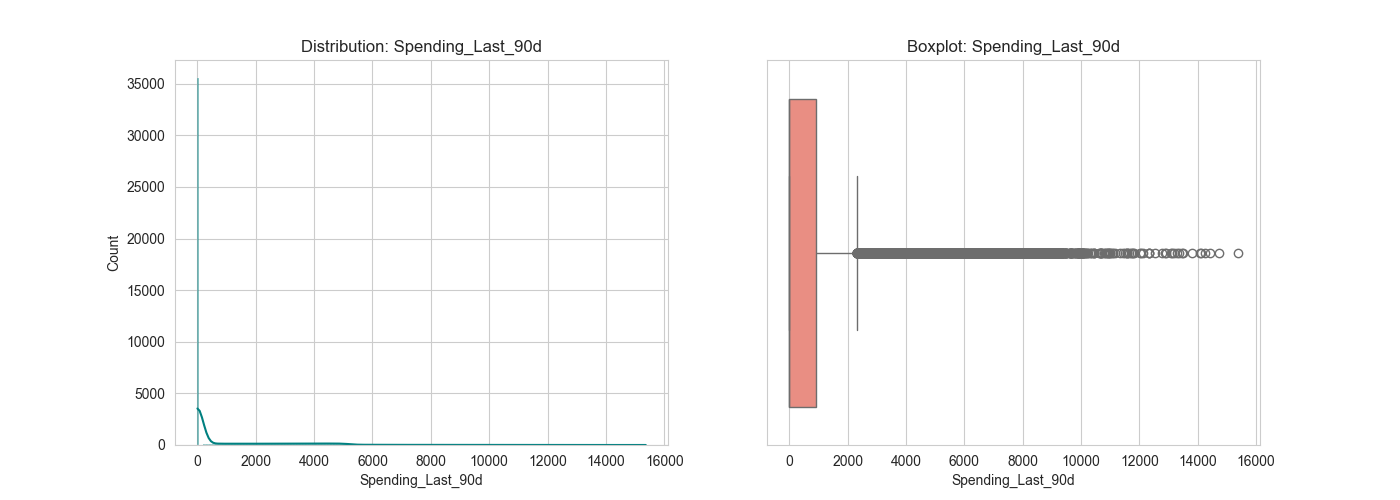
outliers_Spending_Last_90d.png
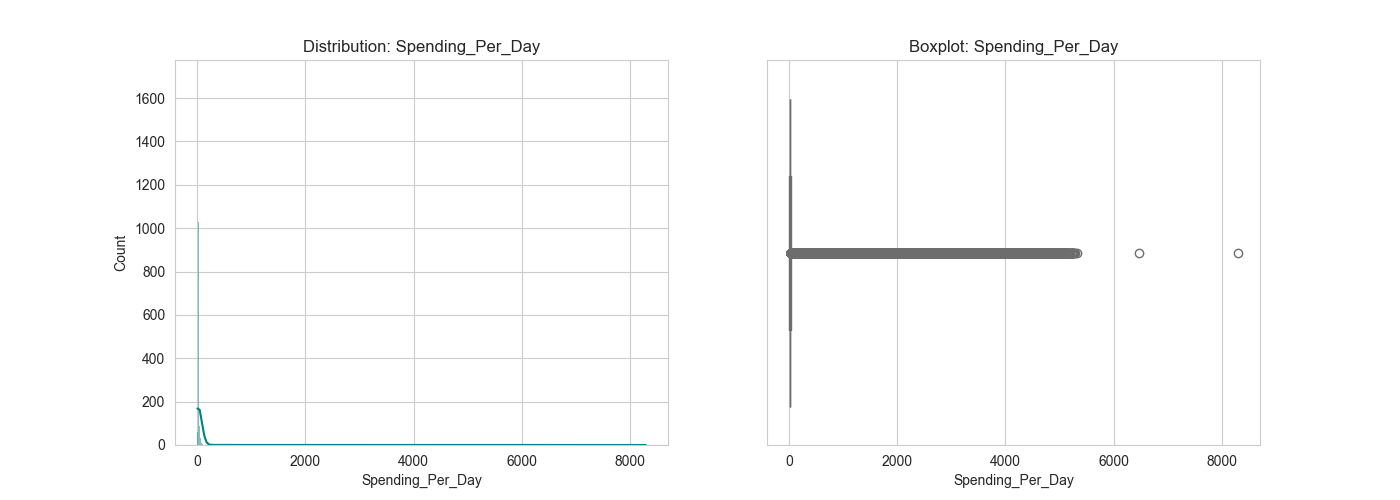
outliers_Spending_Per_Day.png
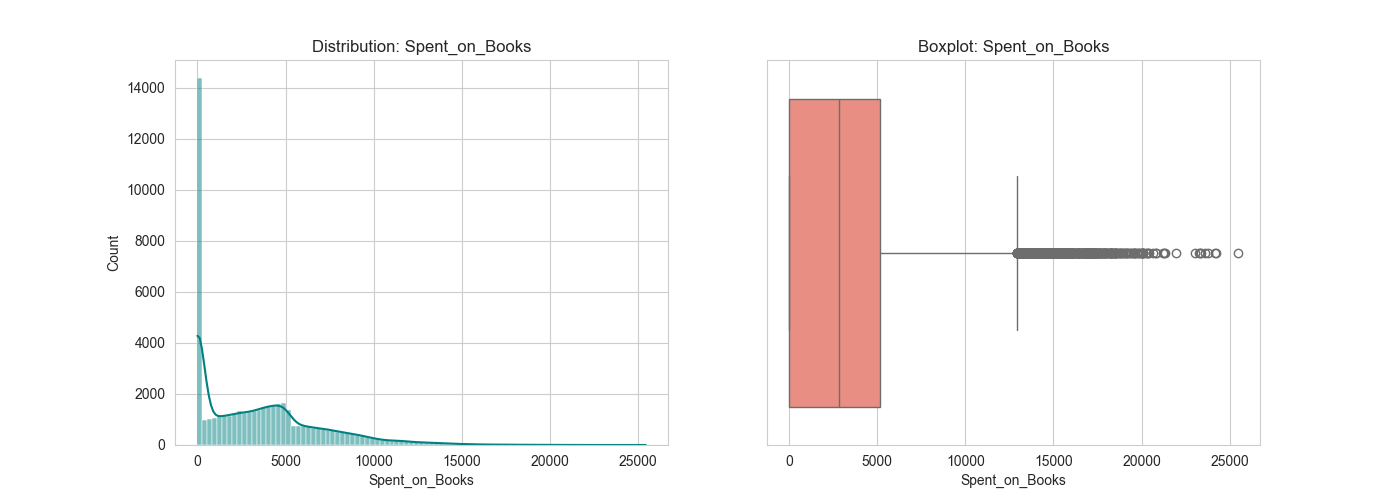
outliers_Spent_on_Books.png
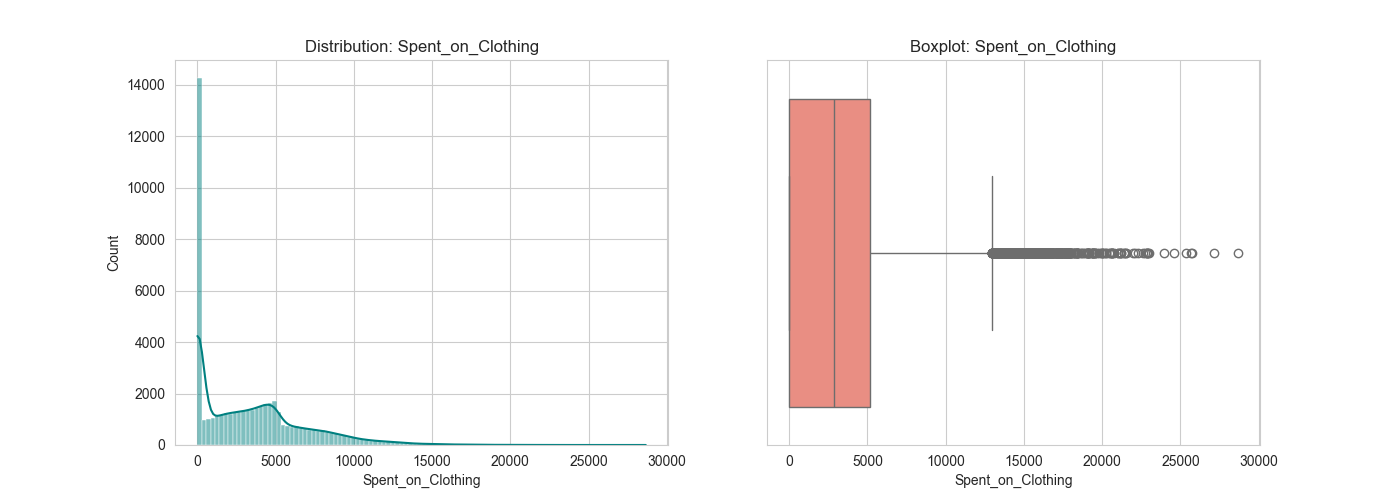
outliers_Spent_on_Clothing.png
outliers_Spent_on_Electronics.png

outliers_Spent_on_Home.png

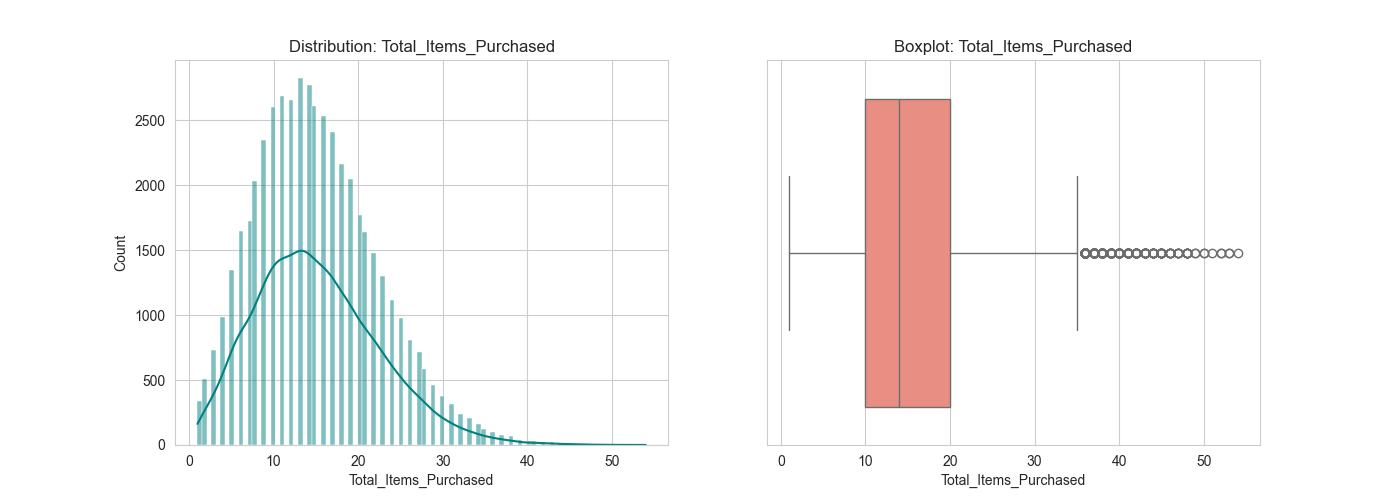
outliers_Total_Items_Purchased.png
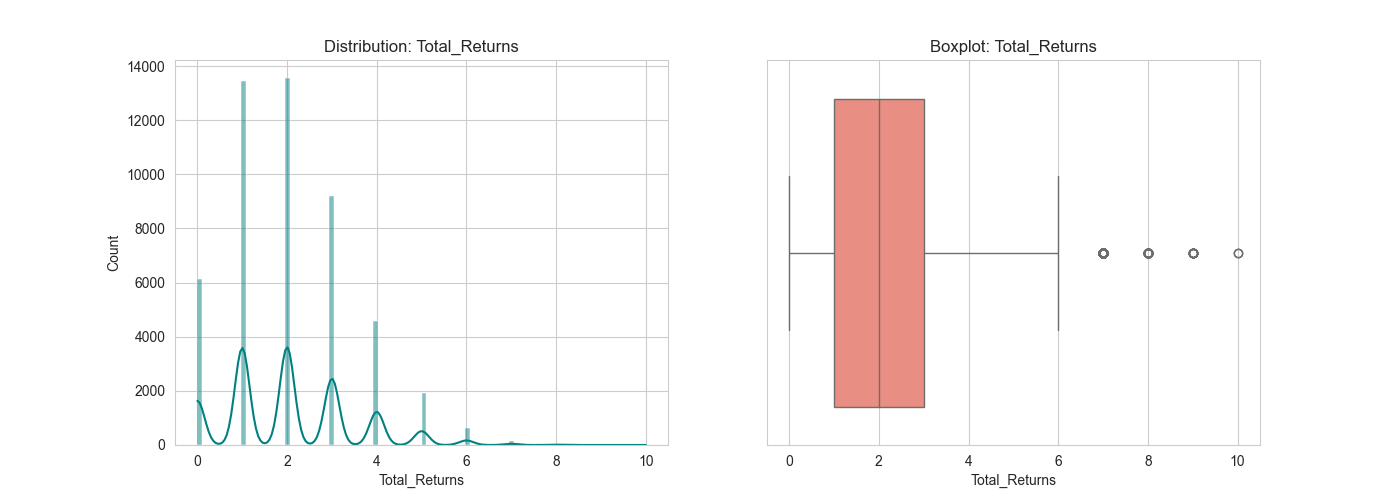
outliers_Total_Returns.png
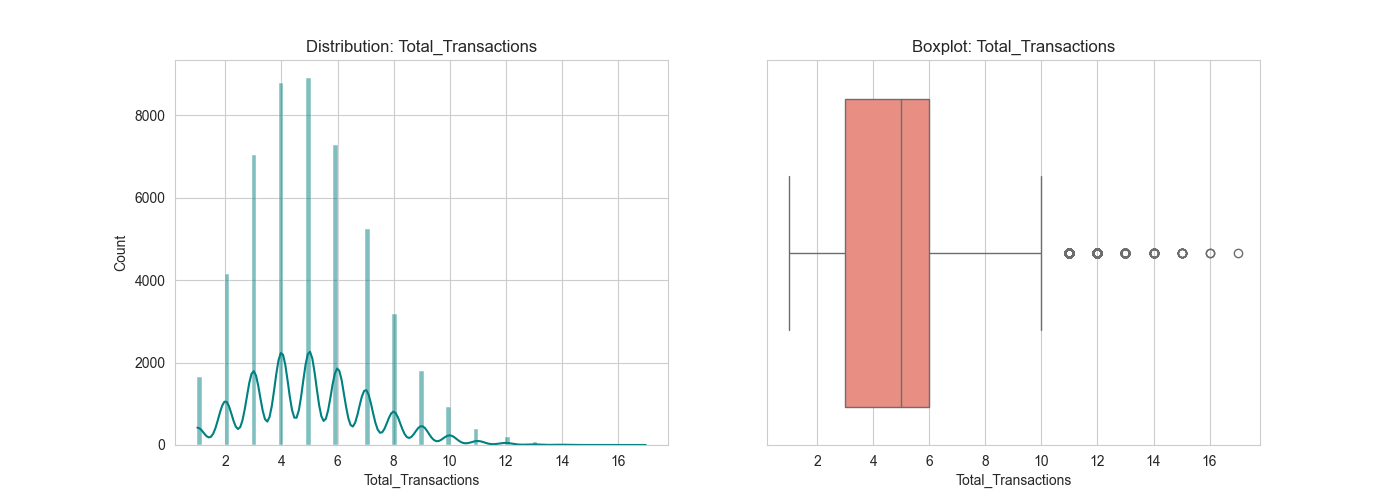
outliers_Total_Transactions.png
outliers_Used_Cash.png

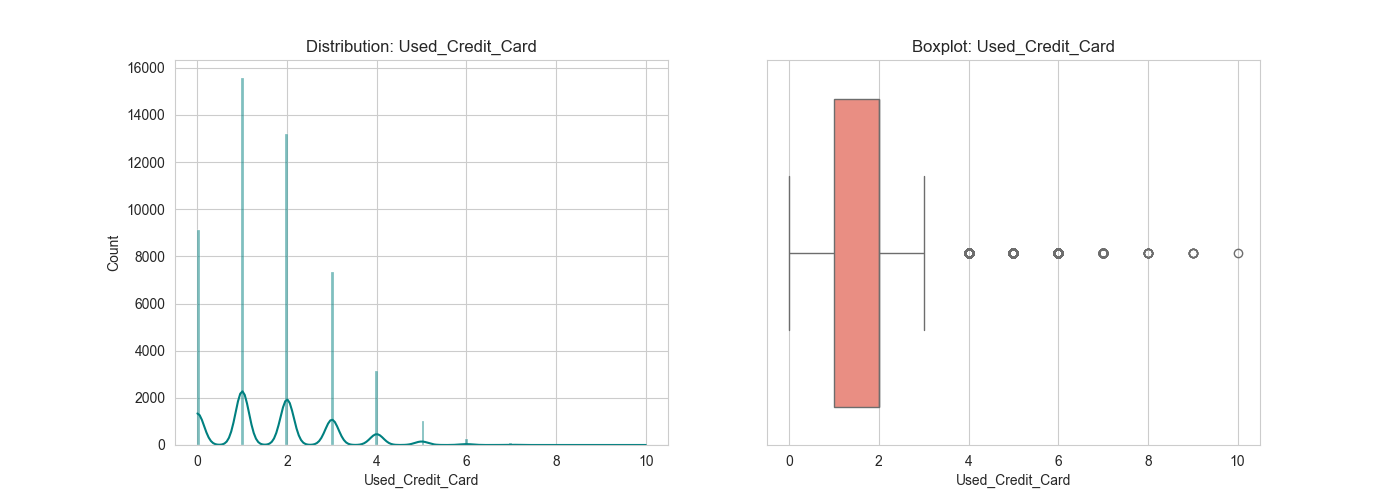
outliers_Used_Credit_Card.png
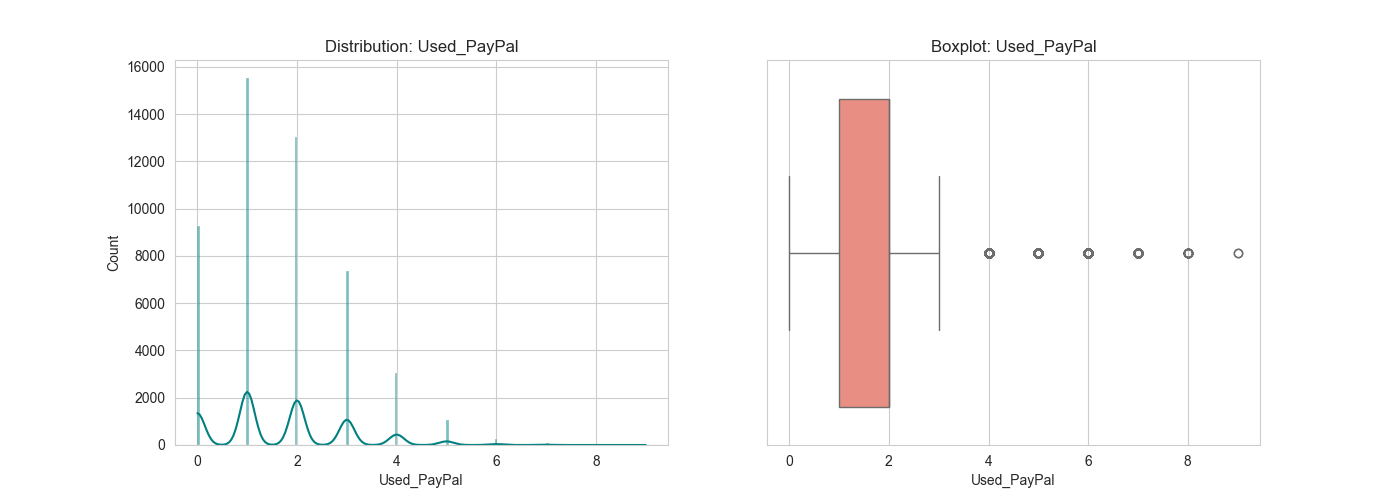
outliers_Used_PayPal.png
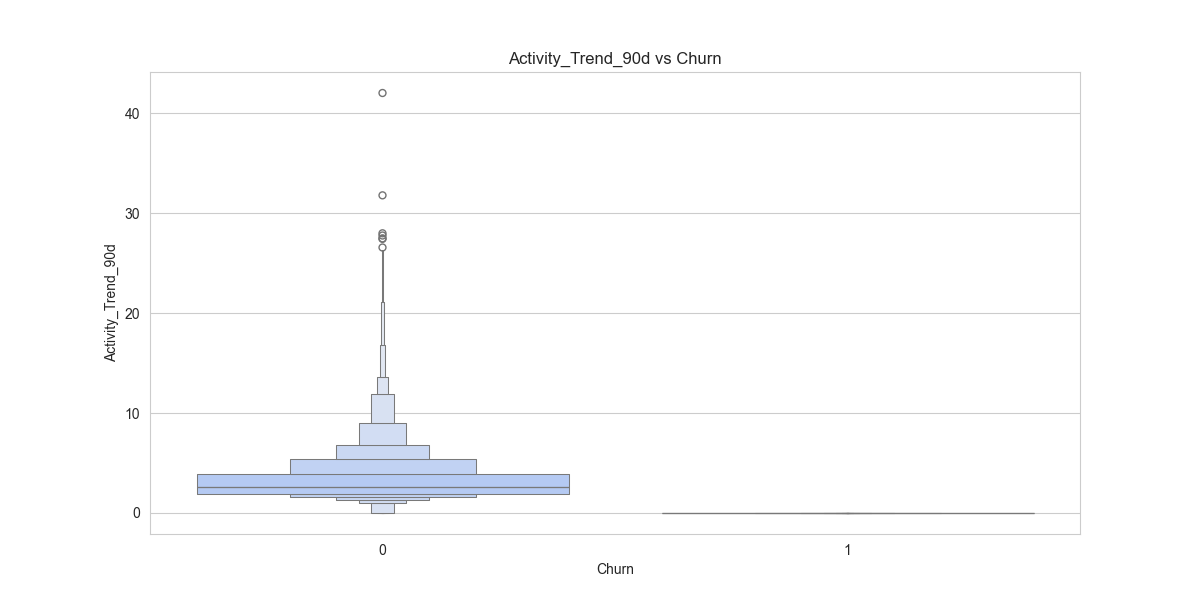
target_rel_Activity_Trend_90d.png
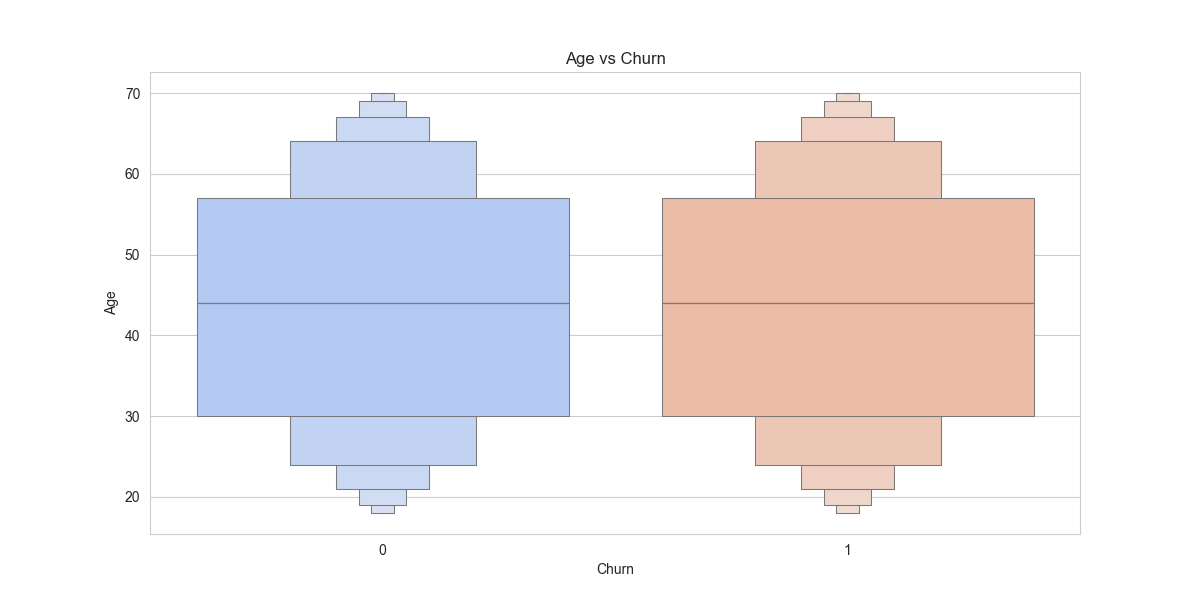
target_rel_Age.png
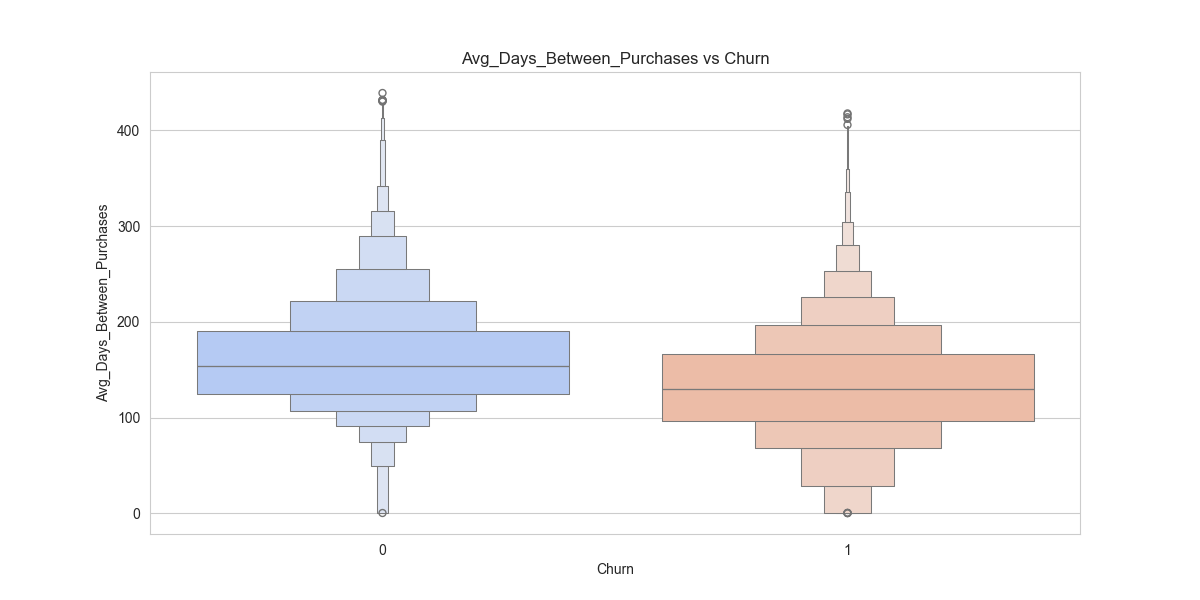
target_rel_Avg_Days_Between_Purchases.png
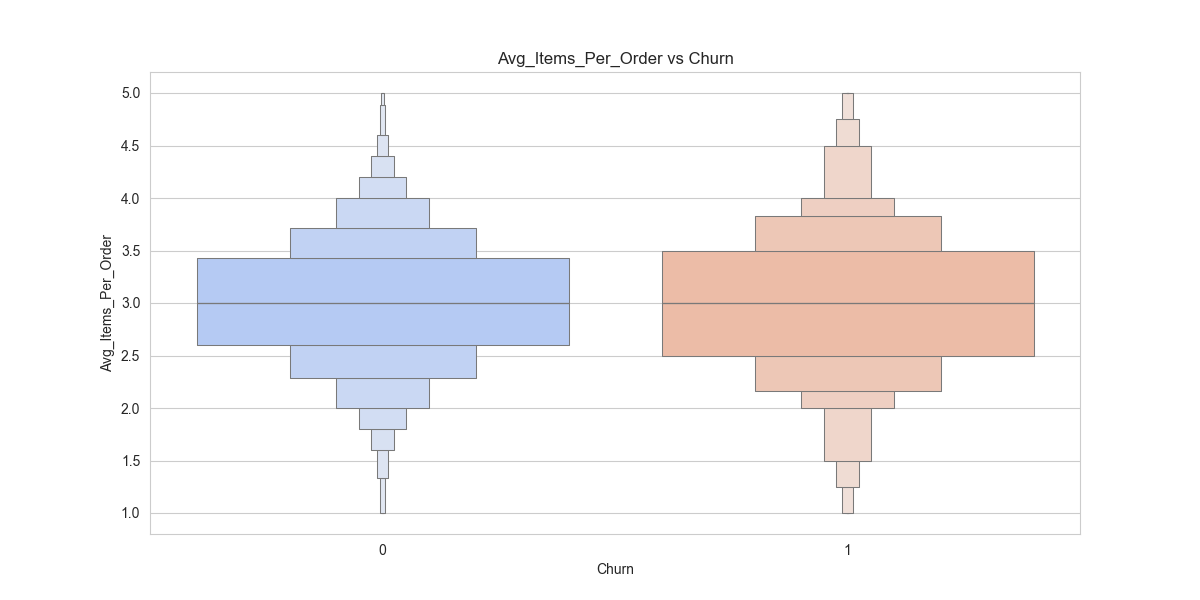
target_rel_Avg_Items_Per_Order.png
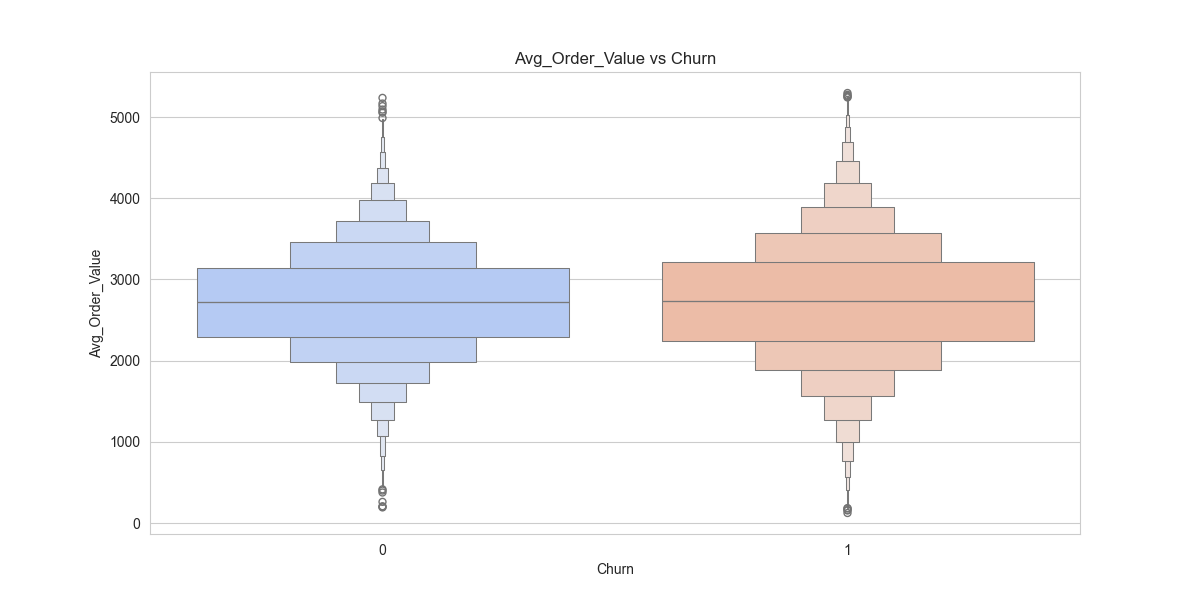
target_rel_Avg_Order_Value.png
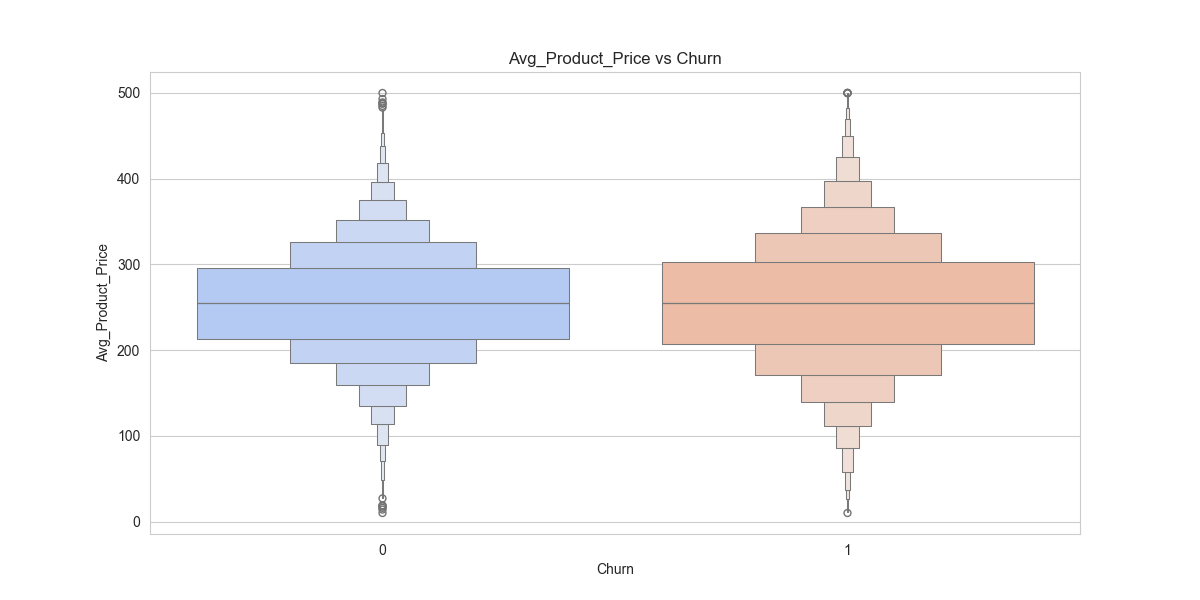
target_rel_Avg_Product_Price.png
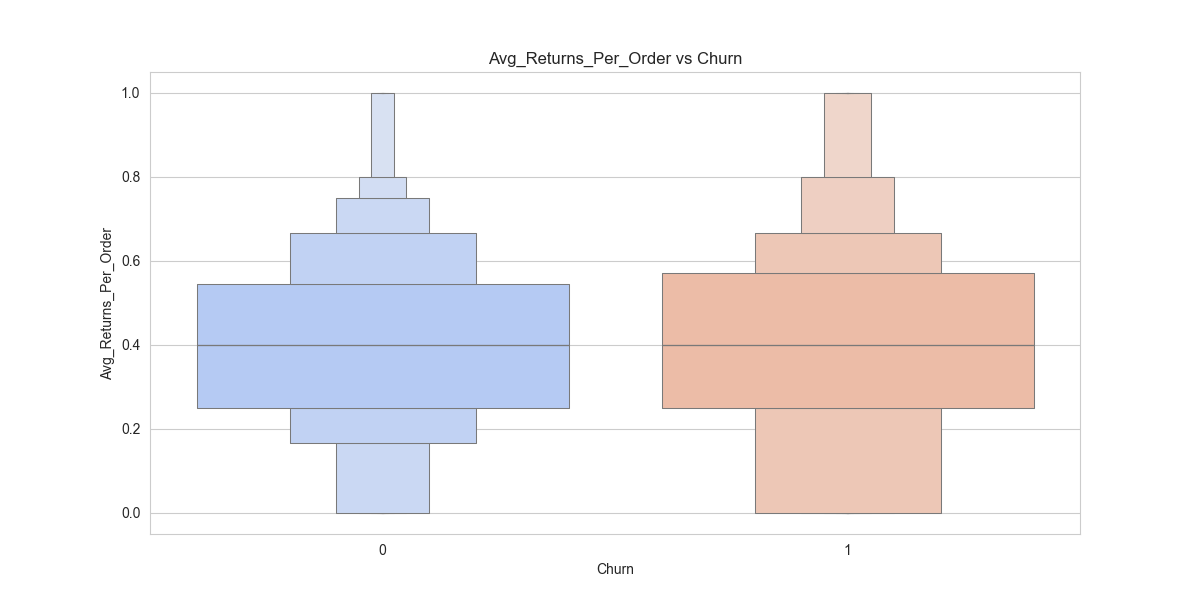
target_rel_Avg_Returns_Per_Order.png
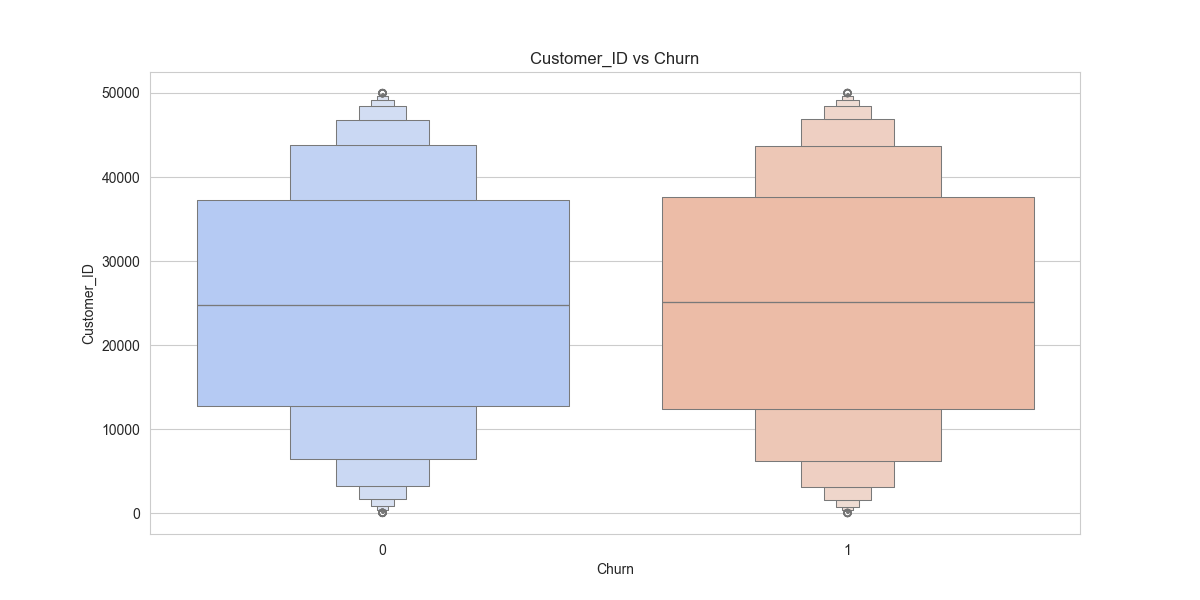
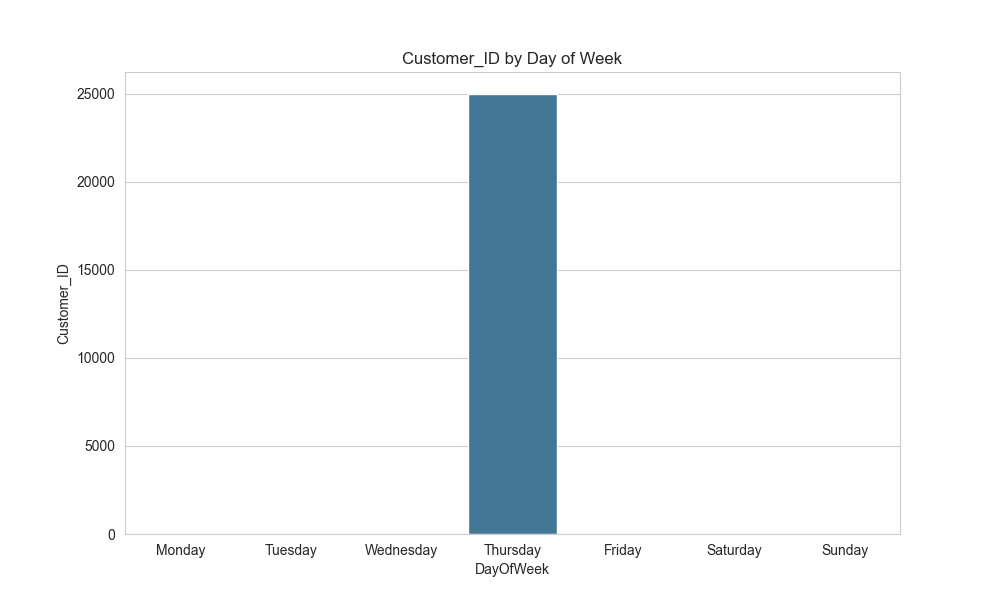
target_rel_Customer_ID.png
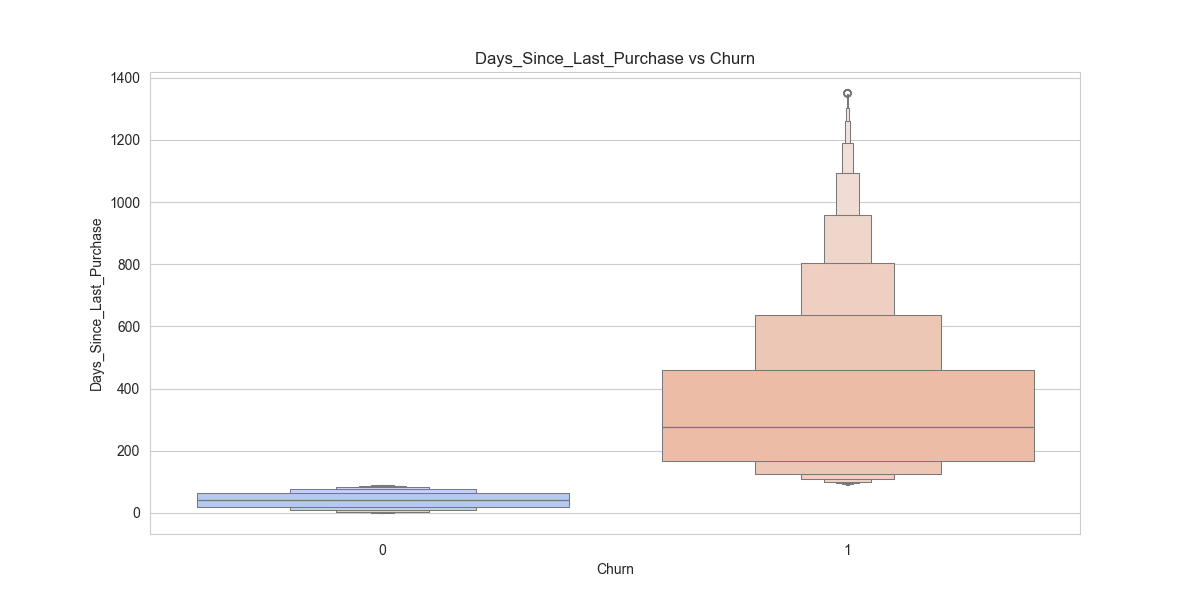
target_rel_Days_Since_Last_Purchase.png
target_rel_Gender.png
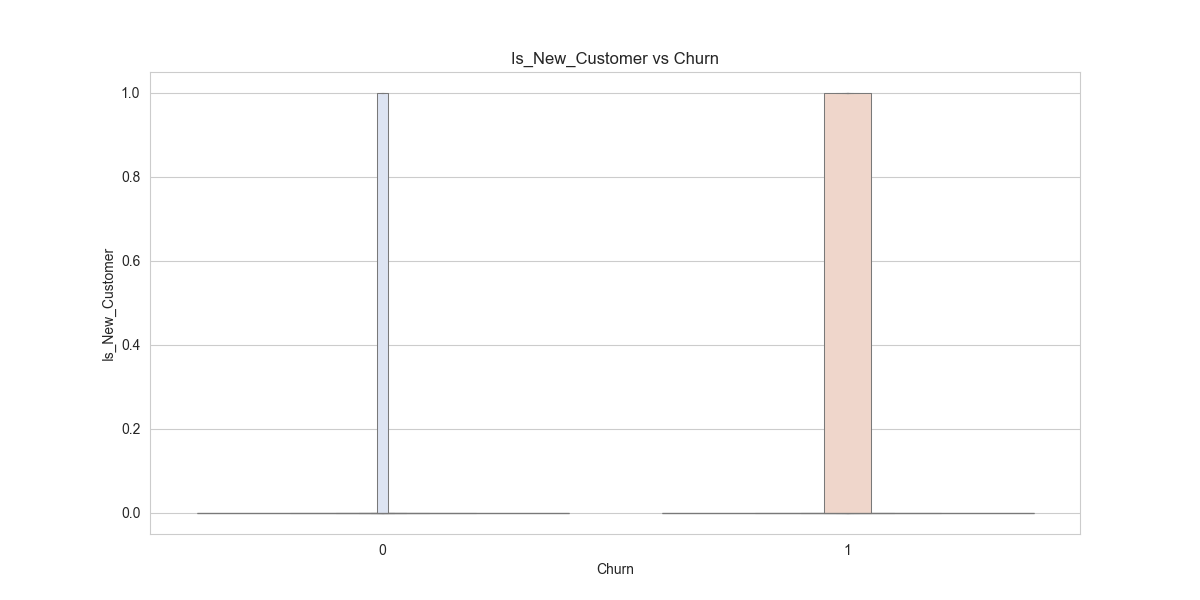
target_rel_Is_New_Customer.png
target_rel_Is_VIP.png
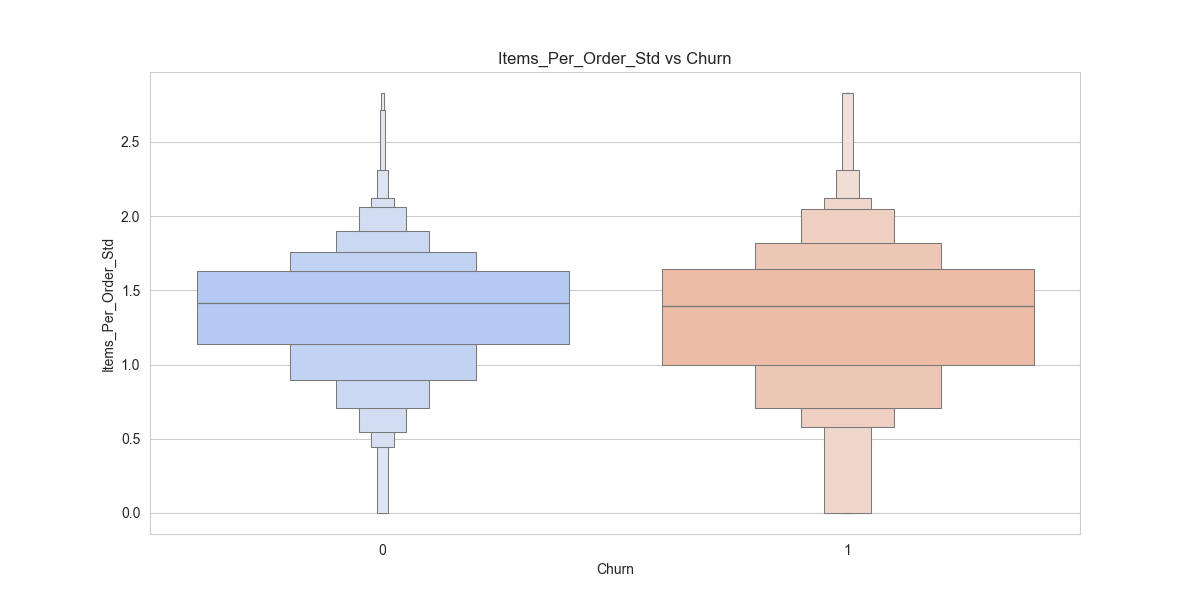
target_rel_Items_Per_Order_Std.png
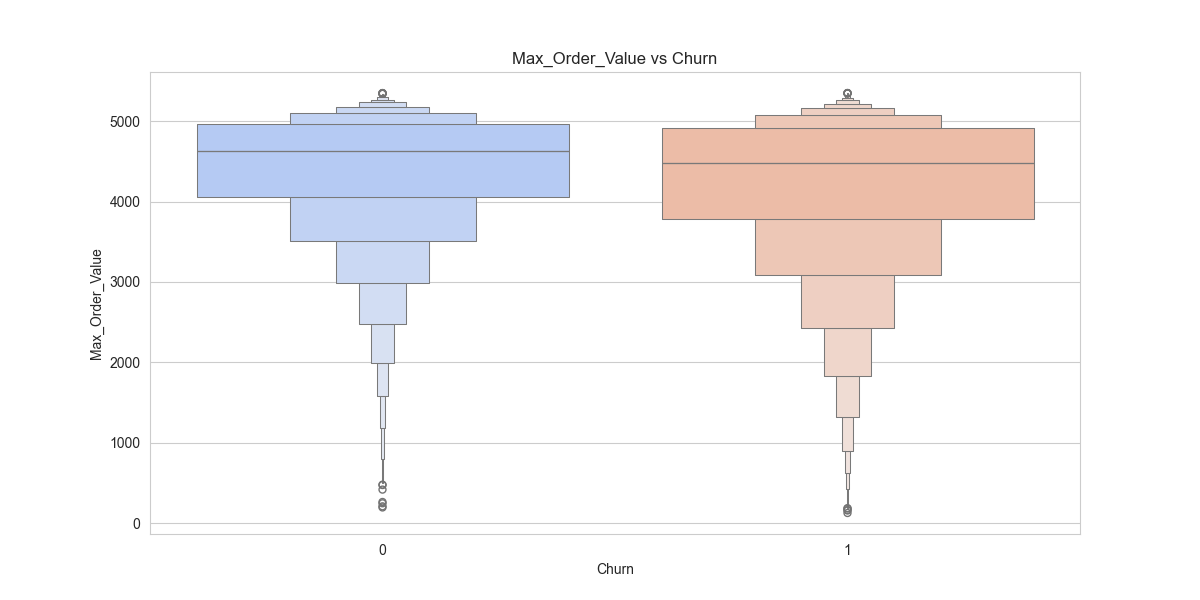
target_rel_Max_Order_Value.png
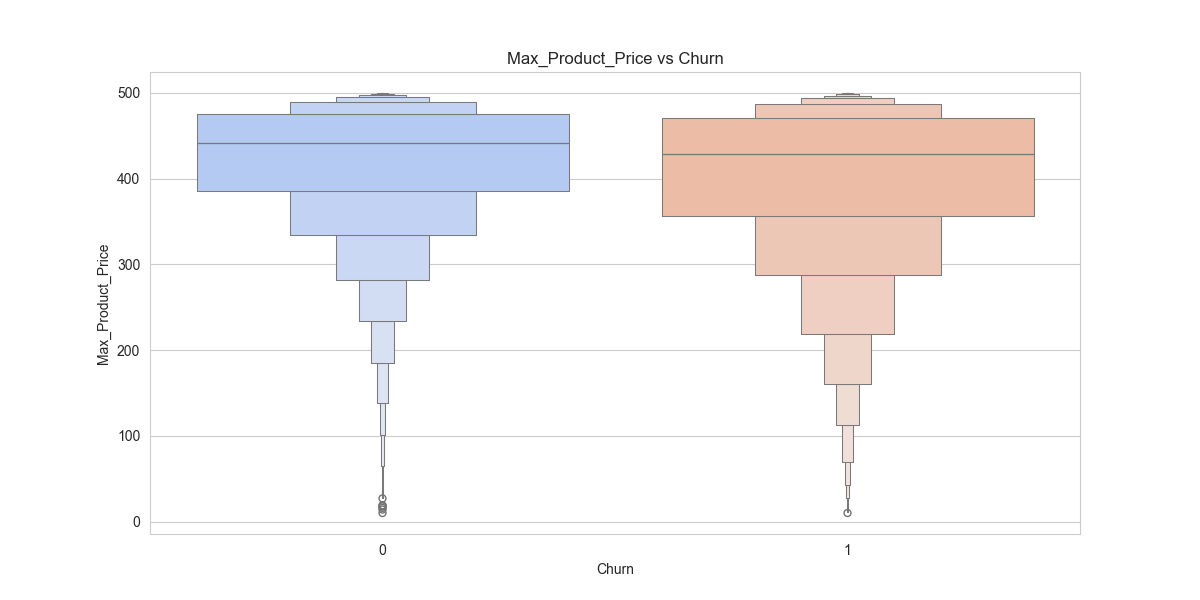
target_rel_Max_Product_Price.png
target_rel_Max_Returns_Single_Order.png
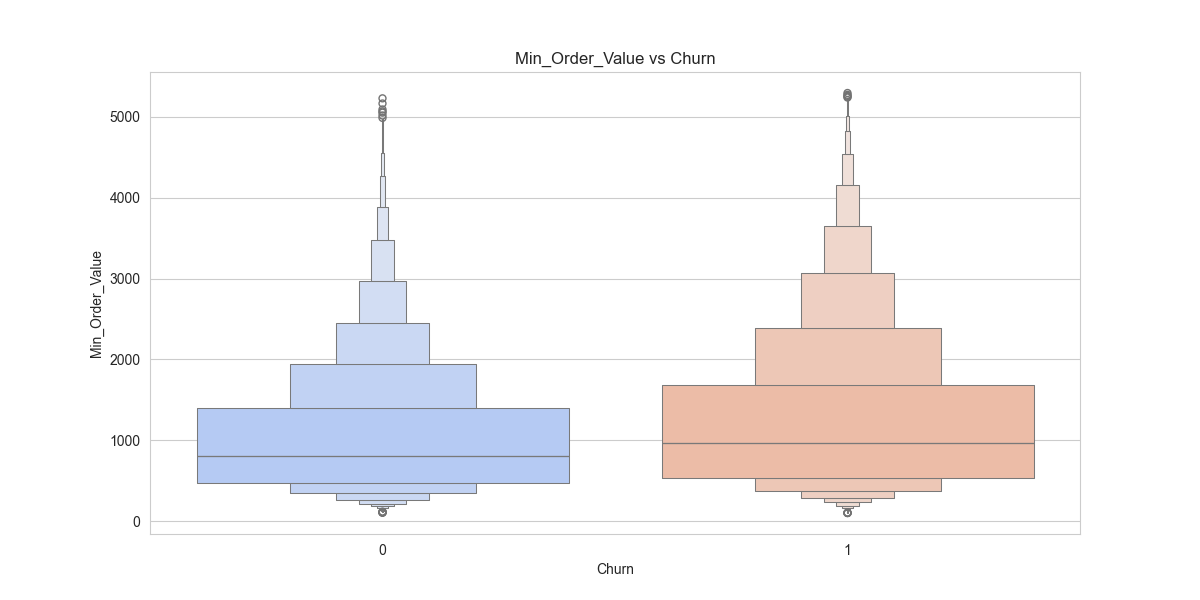
target_rel_Min_Order_Value.png
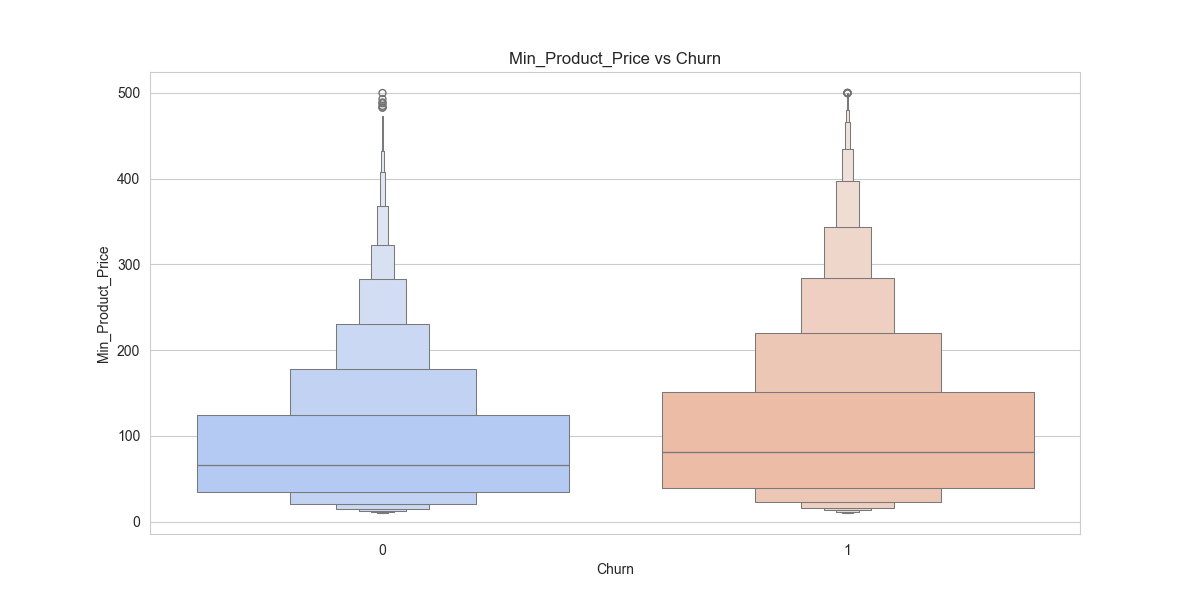
target_rel_Min_Product_Price.png
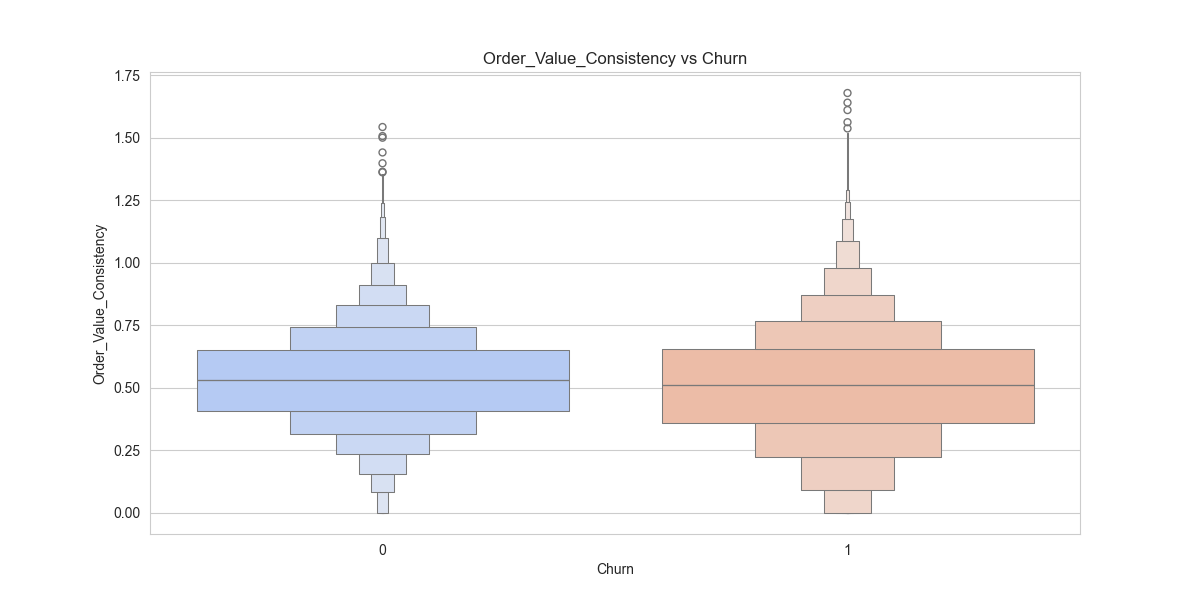
target_rel_Order_Value_Consistency.png
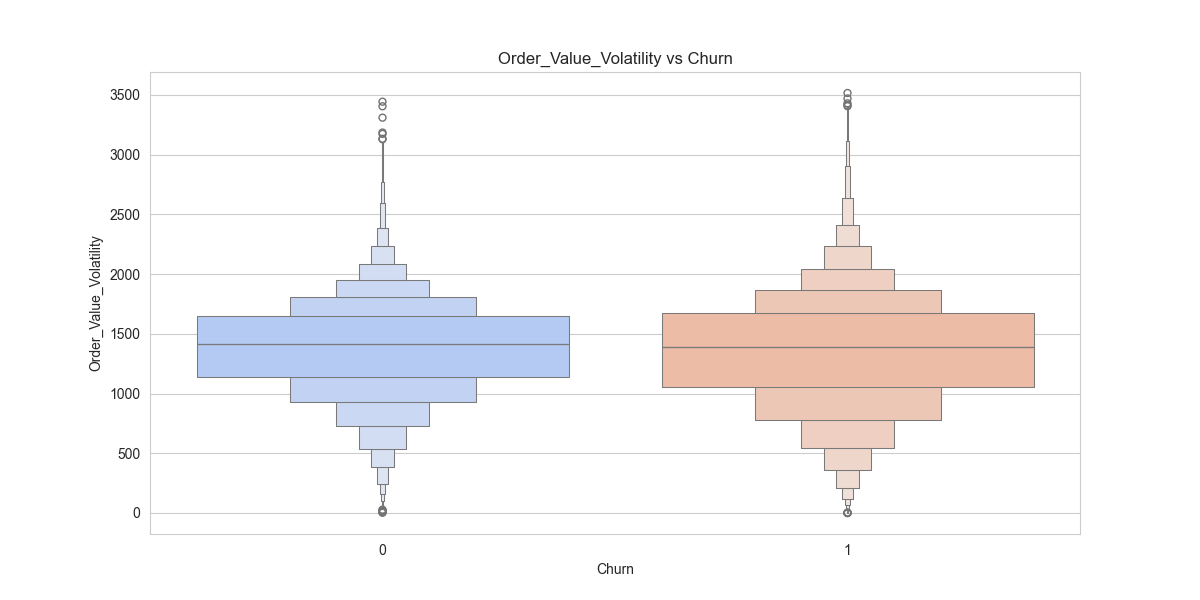
target_rel_Order_Value_Volatility.png
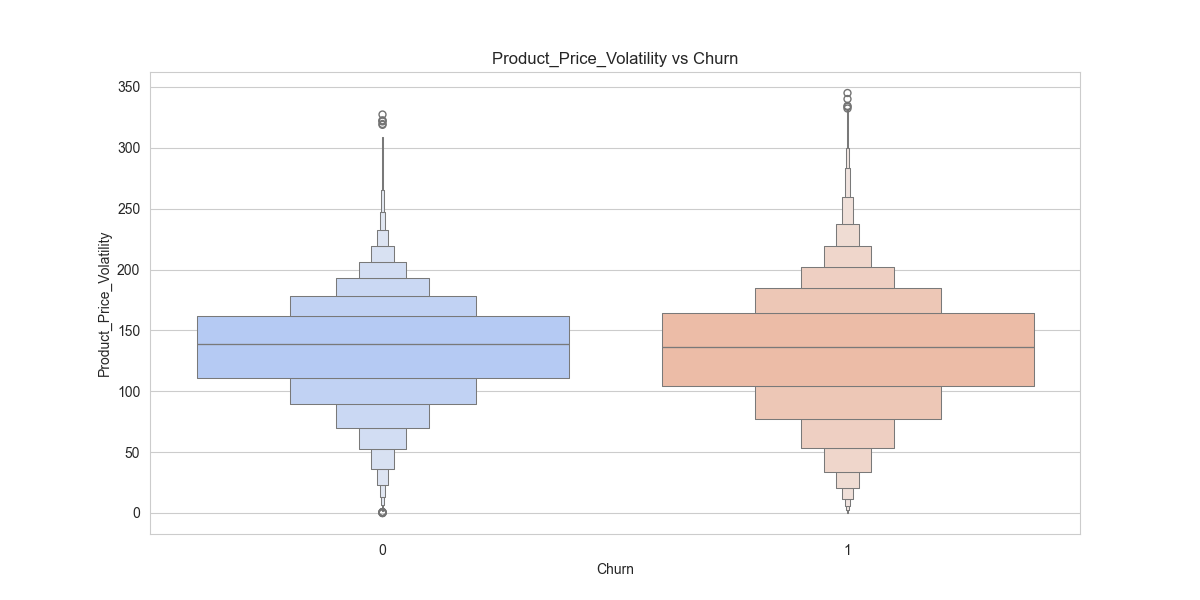
target_rel_Product_Price_Volatility.png
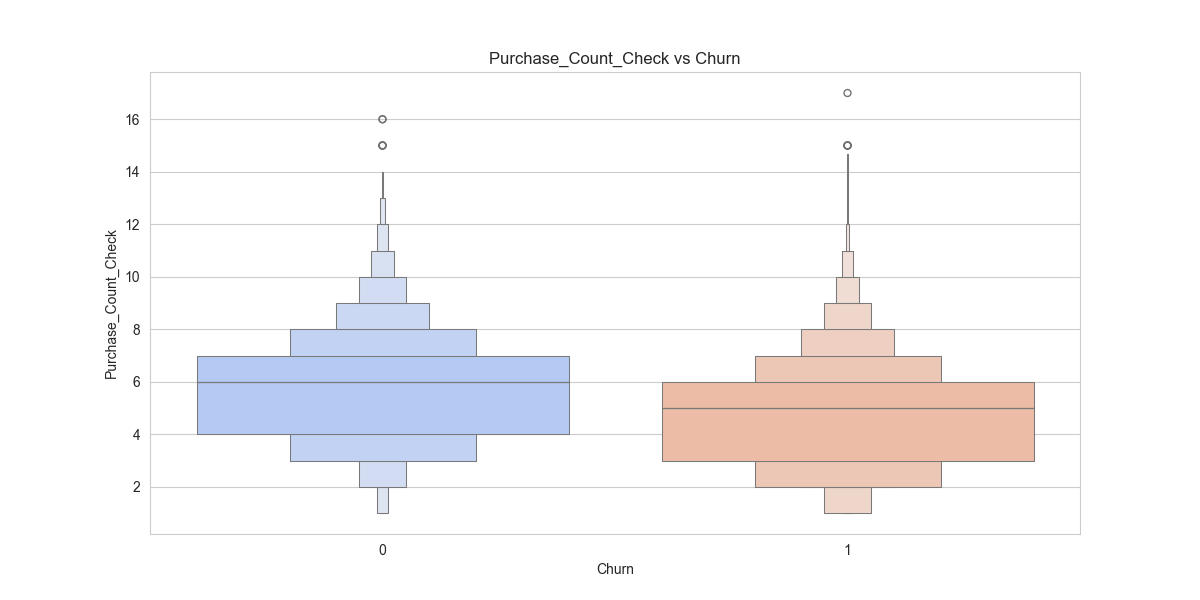
target_rel_Purchase_Count_Check.png
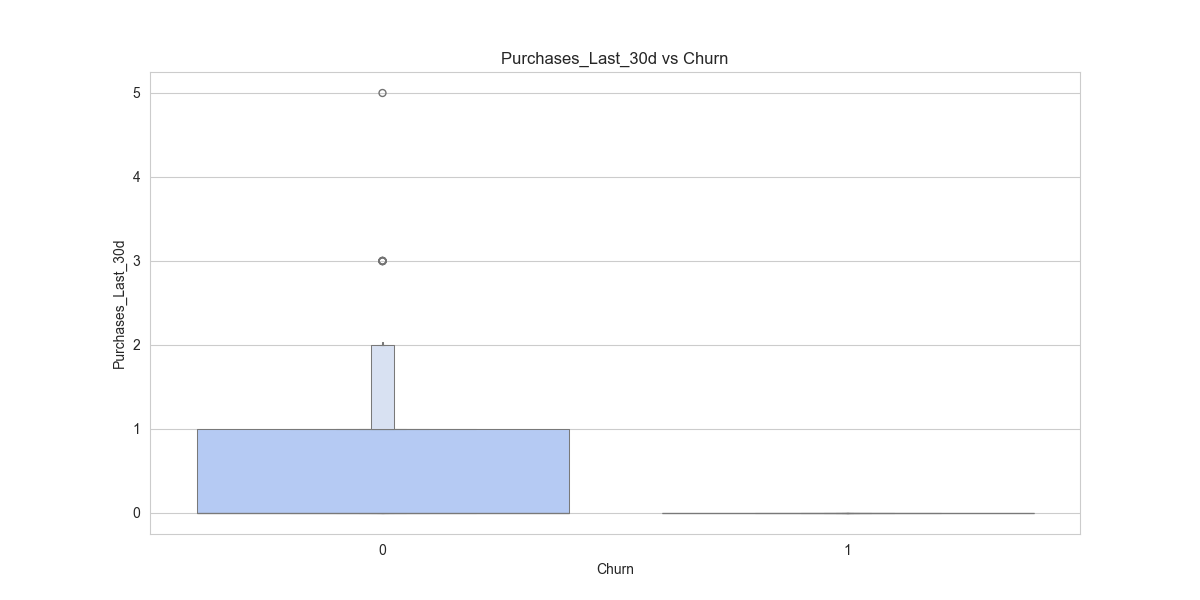
target_rel_Purchases_Last_30d.png
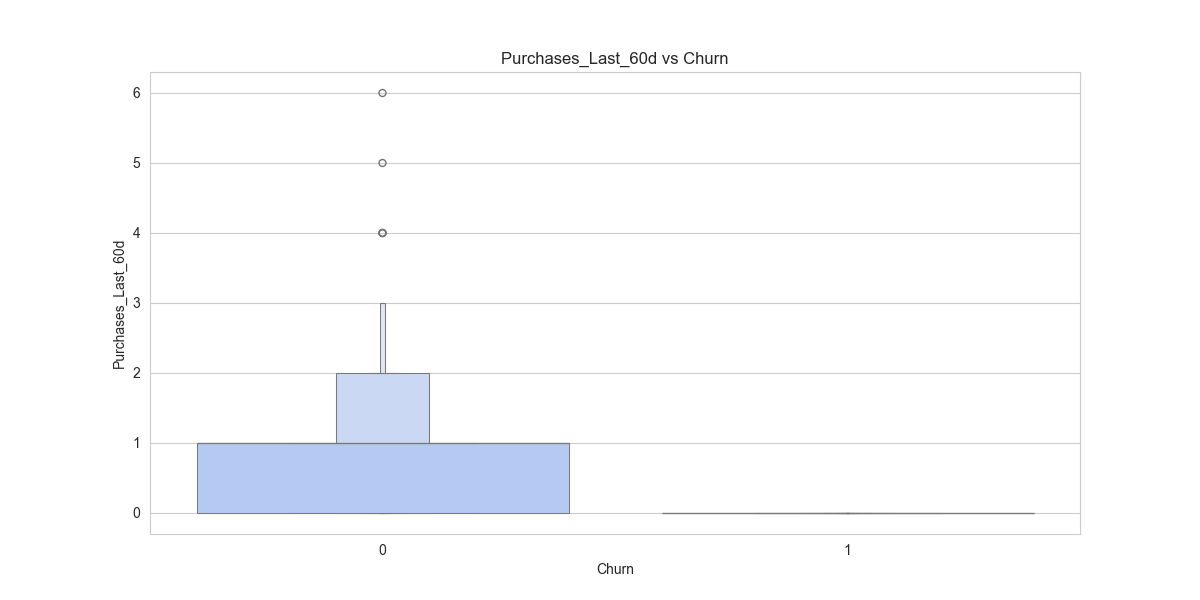
target_rel_Purchases_Last_60d.png
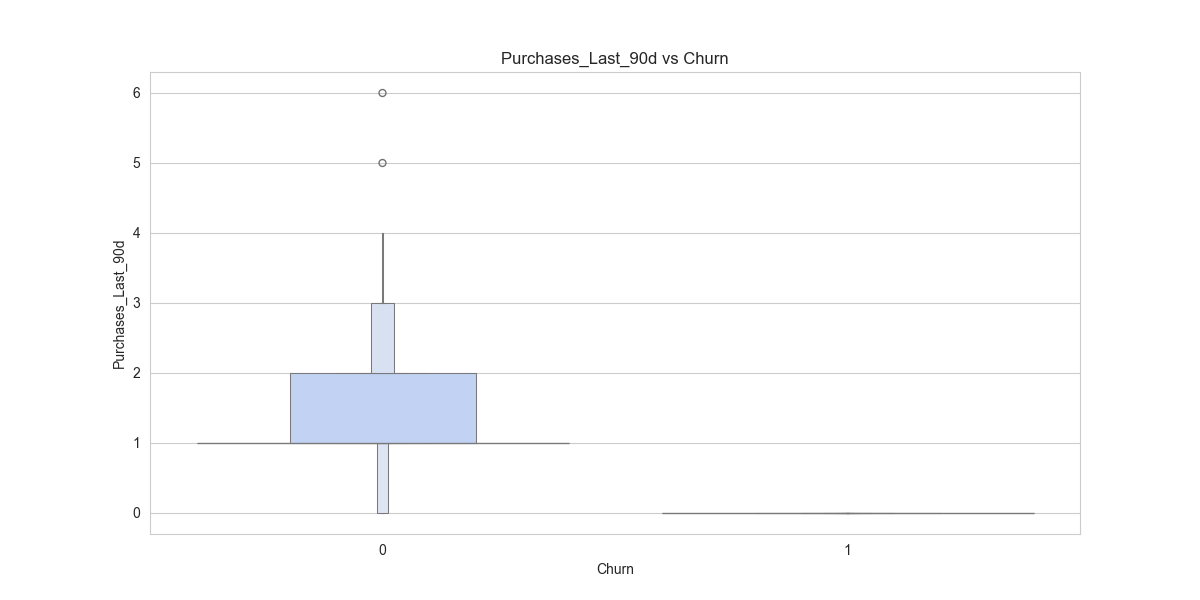
target_rel_Purchases_Last_90d.png
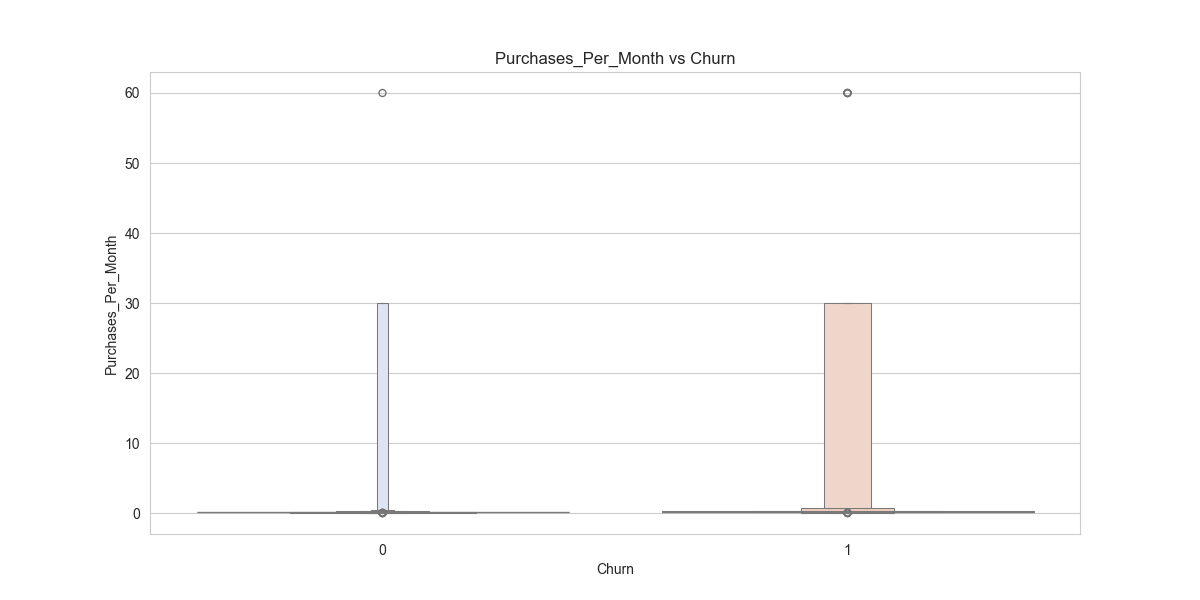
target_rel_Purchases_Per_Month.png
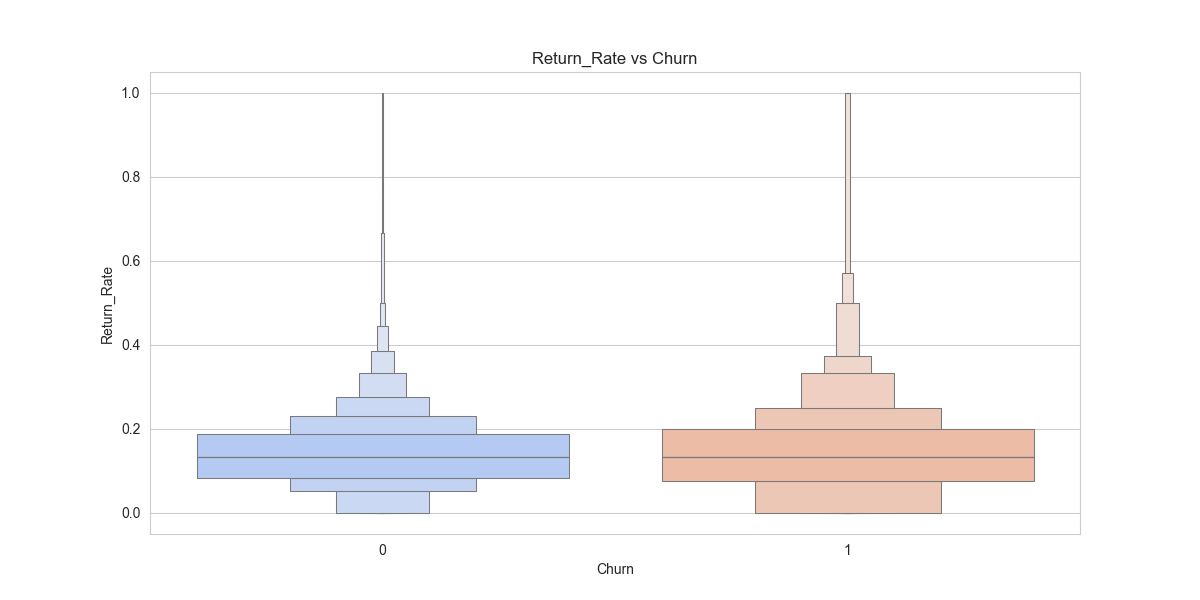
target_rel_Return_Rate.png
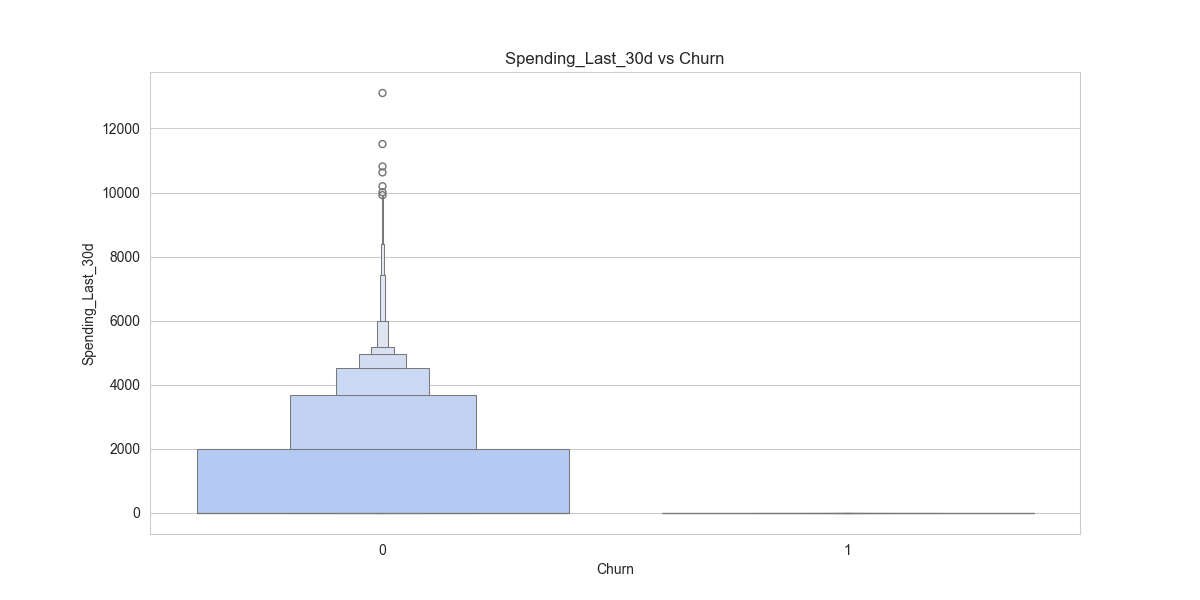
target_rel_Spending_Last_30d.png
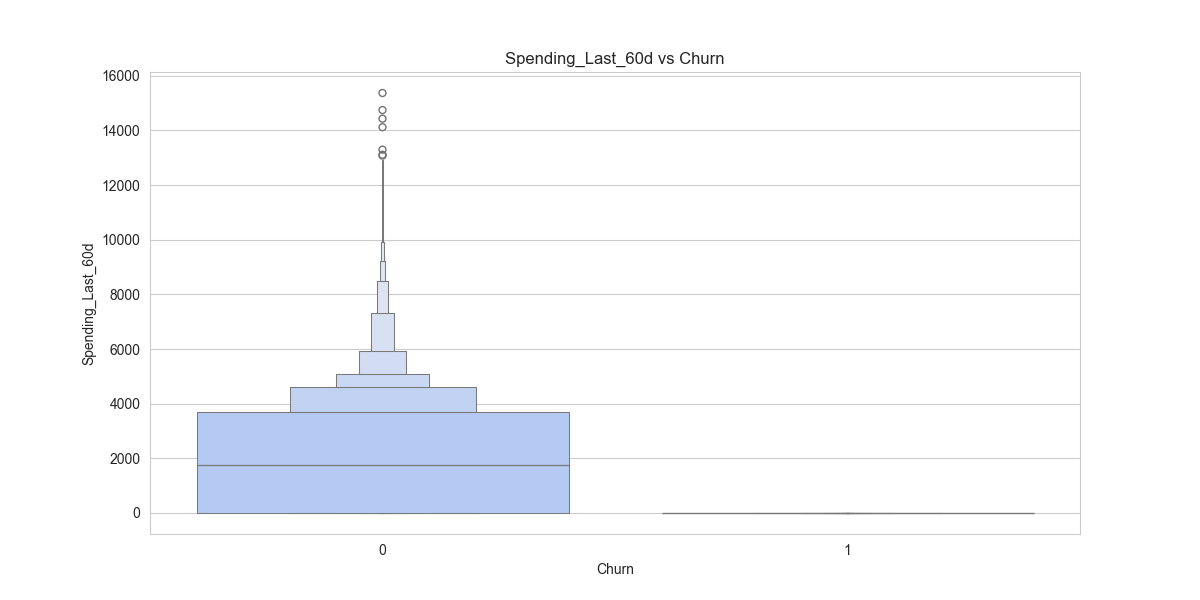
target_rel_Spending_Last_60d.png
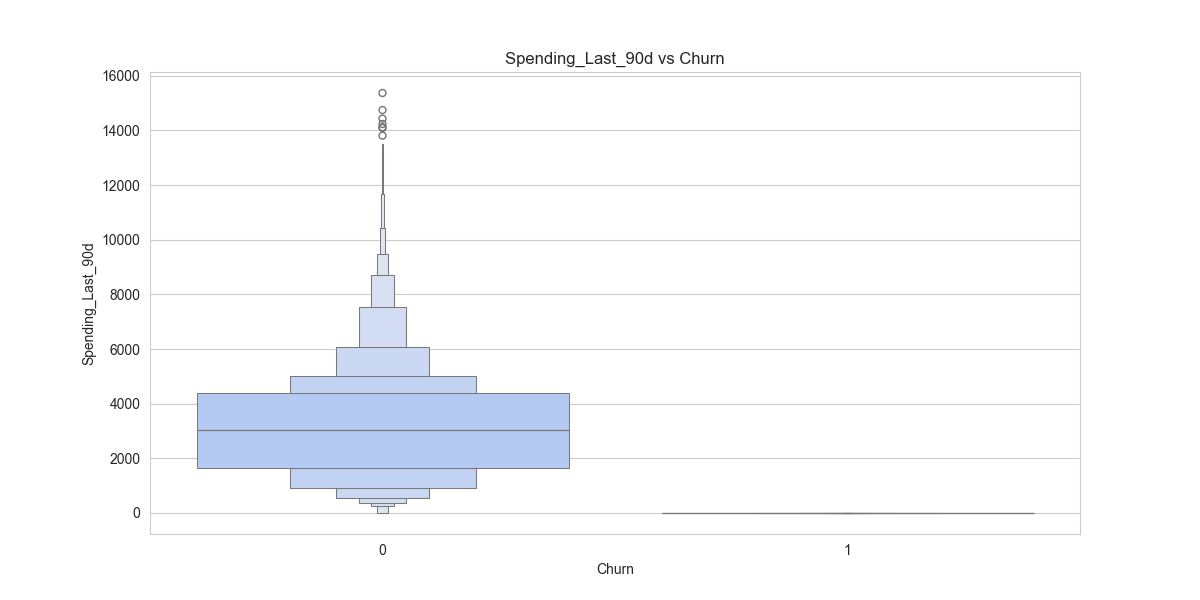
target_rel_Spending_Last_90d.png
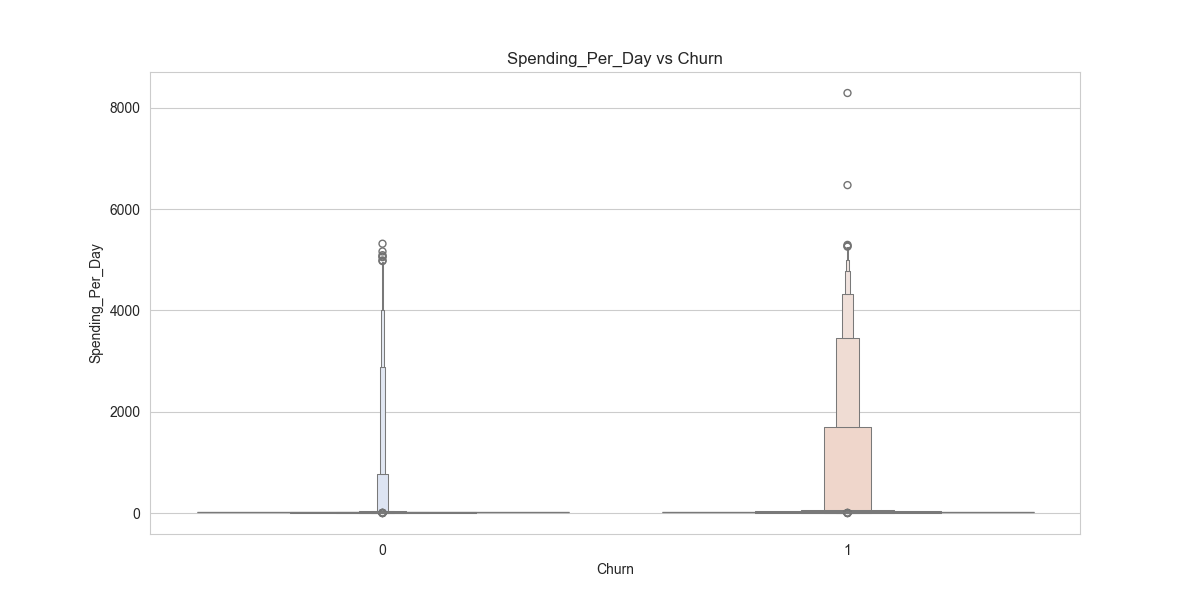
target_rel_Spending_Per_Day.png
target_rel_Spent_on_Books.png

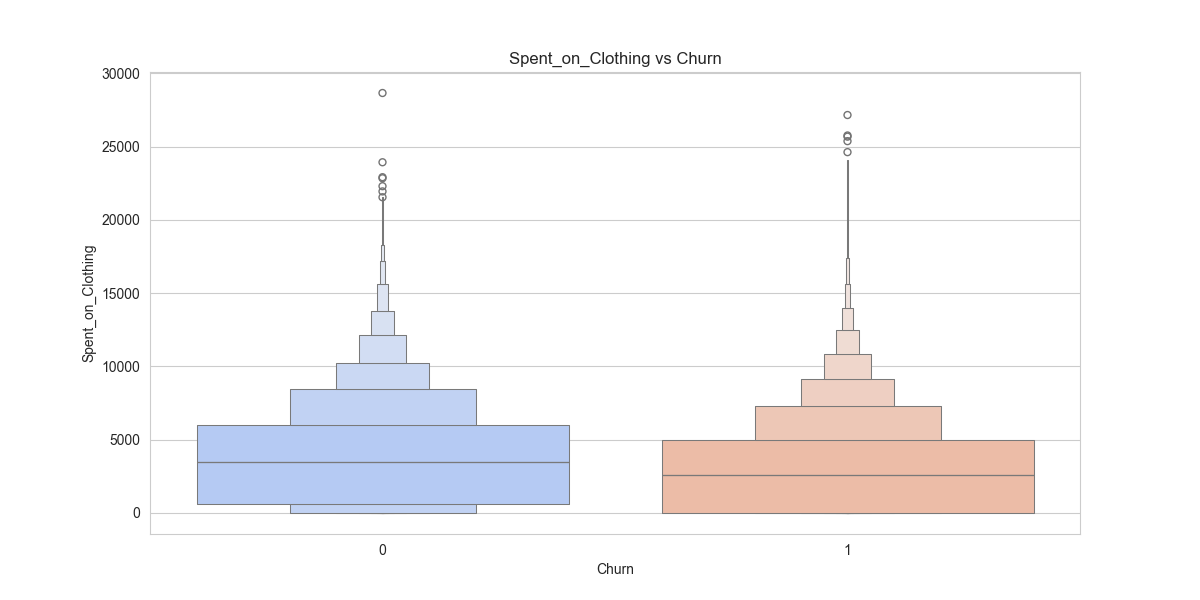
target_rel_Spent_on_Clothing.png
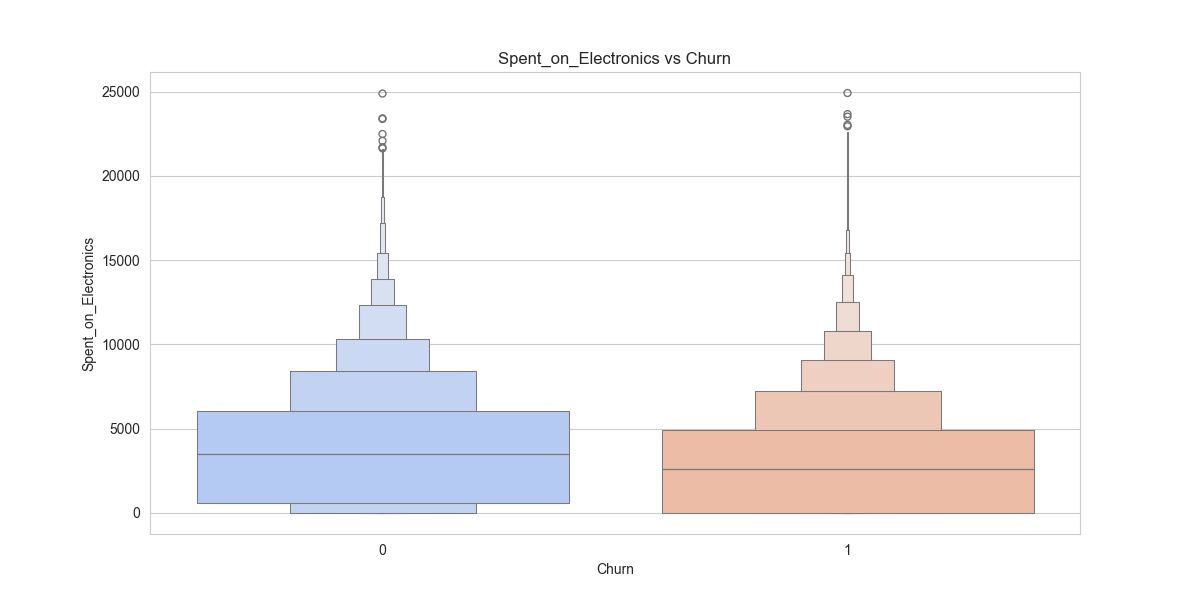
target_rel_Spent_on_Electronics.png
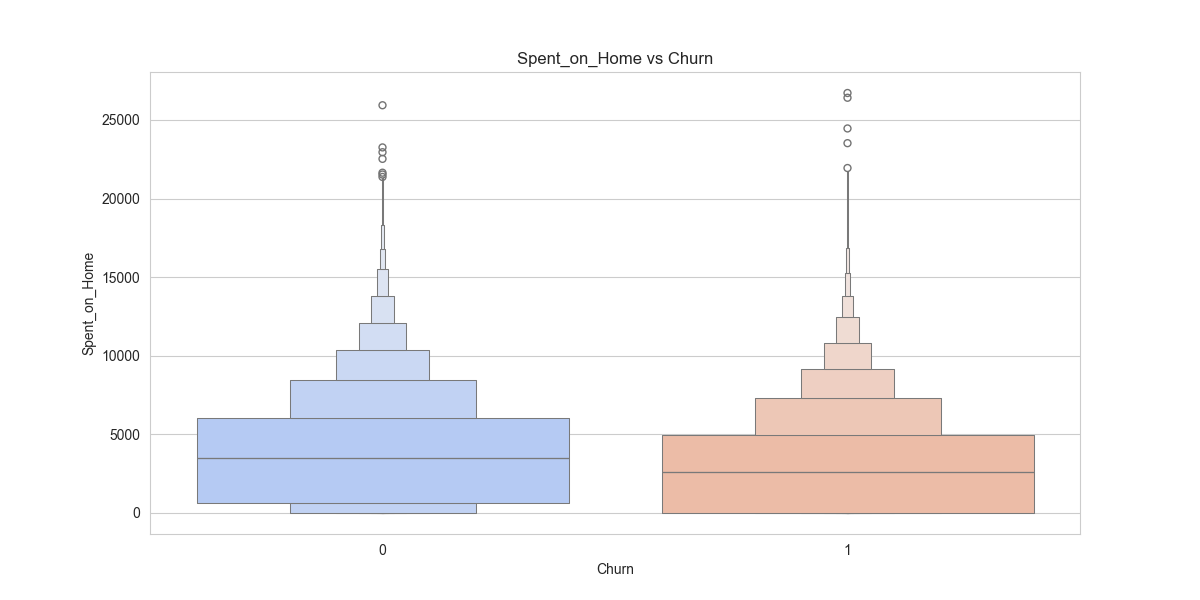
target_rel_Spent_on_Home.png
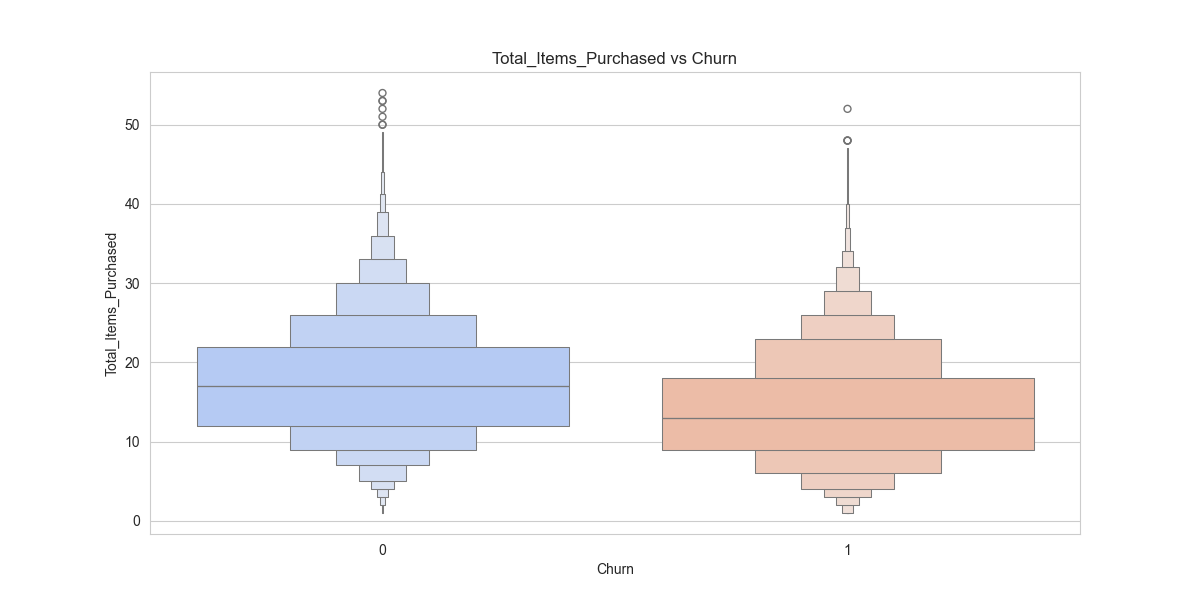
target_rel_Total_Items_Purchased.png
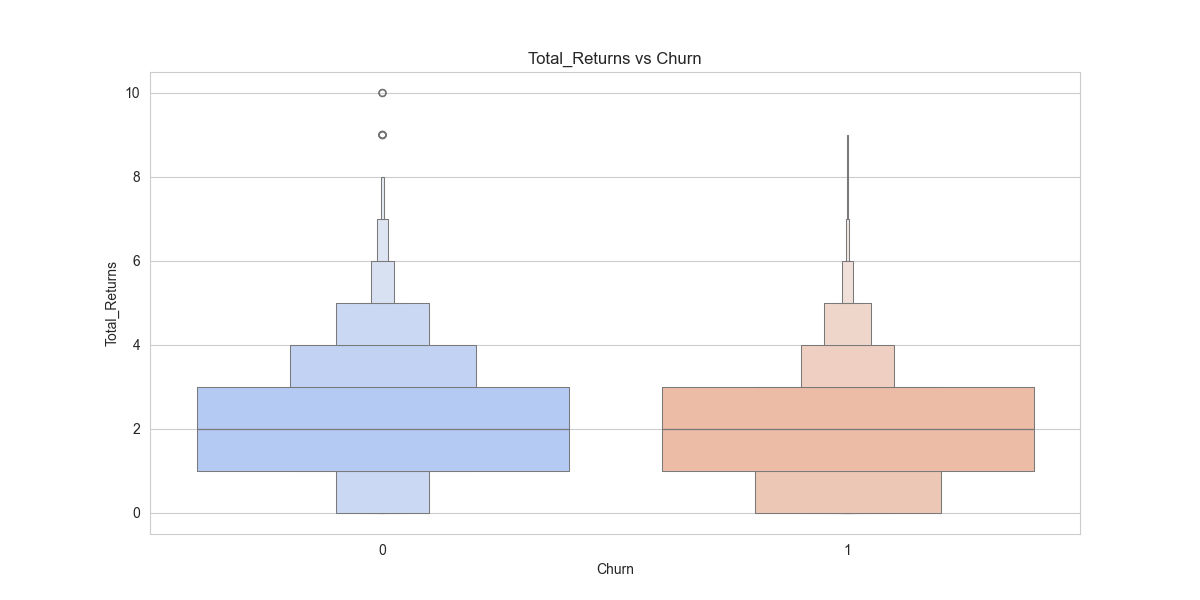
target_rel_Total_Returns.png
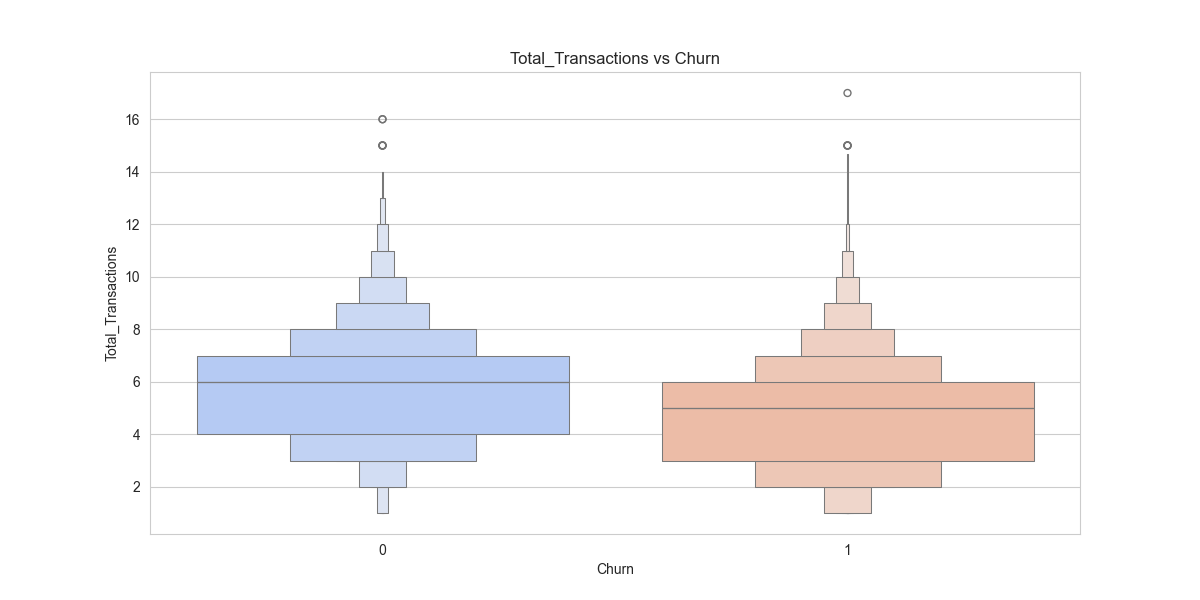
target_rel_Total_Transactions.png
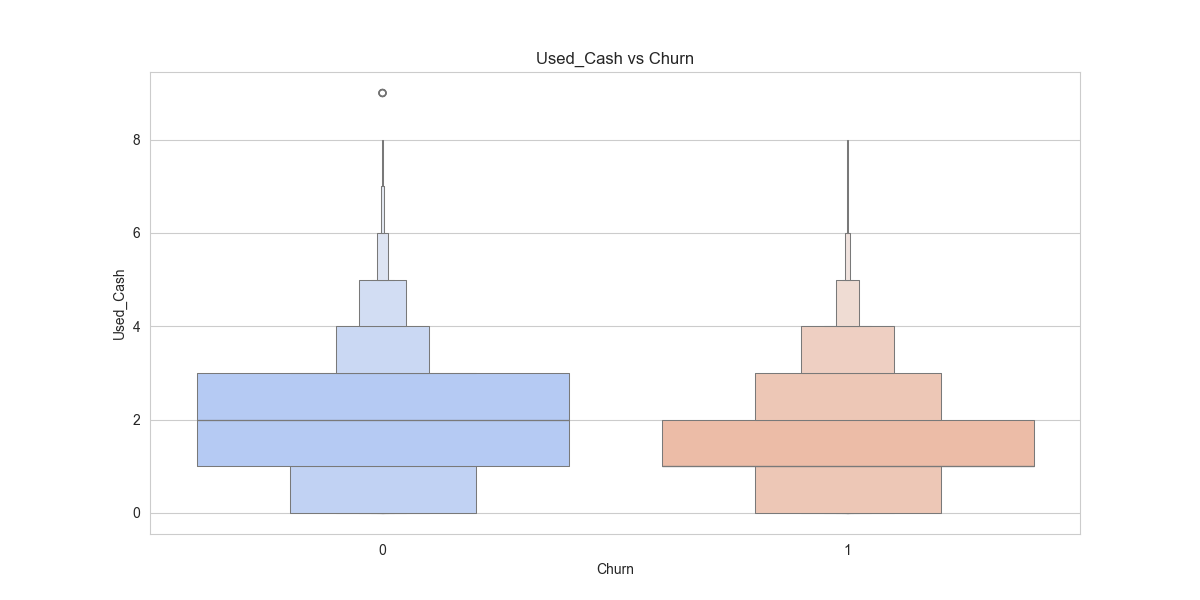
target_rel_Used_Cash.png
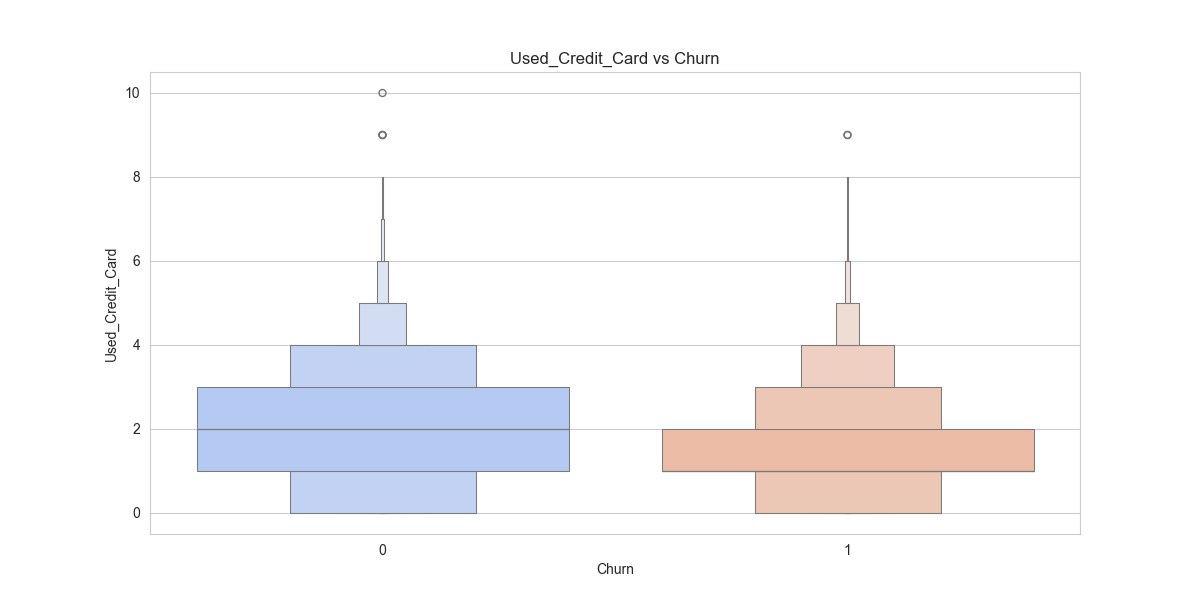
target_rel_Used_Credit_Card.png
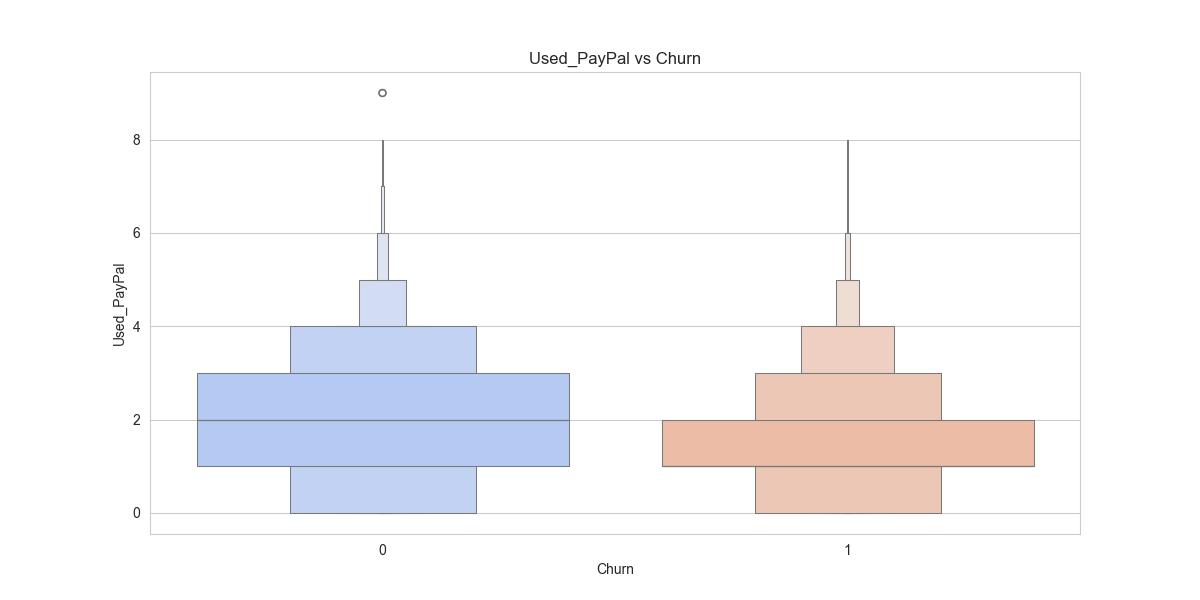
target_rel_Used_PayPal.png
time_series_seasonality.png
time_series_trend.png